Apple’s Stock In Focus: More Profitable Than Banks
May 04, 2023

Beth Kindig
Lead Tech Analyst

This article was originally published on Forbes on May 1, 2023,10:07pm EDT
Investors looking for the “next big thing” will point toward companies like Stripe, Sofi or Square as the leading fintech stocks. Meanwhile, the next big thing to disrupt the financial sector may be sitting in plain sight. Apple grew its cash trove through legendary design and hardware, yet how Apple chooses to leverage its enormous reserve of cash may be what writes the next chapter for the world’s most valuable company.
The markets have clearly shifted from favoring top line growth to emphasizing bottom line strength. This reminder is echoed across every industry, but none more so than the finance industry where regional banks are defaulting due to high bond rates and depositor withdrawals.
It’s easy to dismiss the financial sector in today’s tech focused market. After all, financials only account for 11% of the total market cap of the S&P 500, with 3 sectors ahead of it. However, all companies depend on loans, and when banks get scared, the credit window shuts, which tends to lead to outsized bankruptcies. Simply put, banks cause the worst kinds of recessions. We detailed this more here.
Today, the tech industry has disrupted nearly every industry in its path from energy, to commerce, to automotive, to entertainment. Perhaps now is the time that tech will finally disrupt the banking sector.
Apple Is More Profitable Than Banks
JP Morgan has over $1.4 trillion on its balance sheet compared to Apple’s $165 billion. However, Apple is more profitable with $99 billion in profit last year, which is higher than JP Morgan and Citi combined. What Apple has to boot is access to 1.2 billion iPhone users. Therefore Apple may not have as much cash as a bank, but it’s fundamentally a more investable business model.
For stock investors, Apple’s large cash reserves are certainly not news as the company has more cash than any other tech stock. What’s news is that the FED is aggressively draining liquidity from the system as a means to fight inflation, as shown in the chart below, that compares the trends in liquidity to the S&P 500.

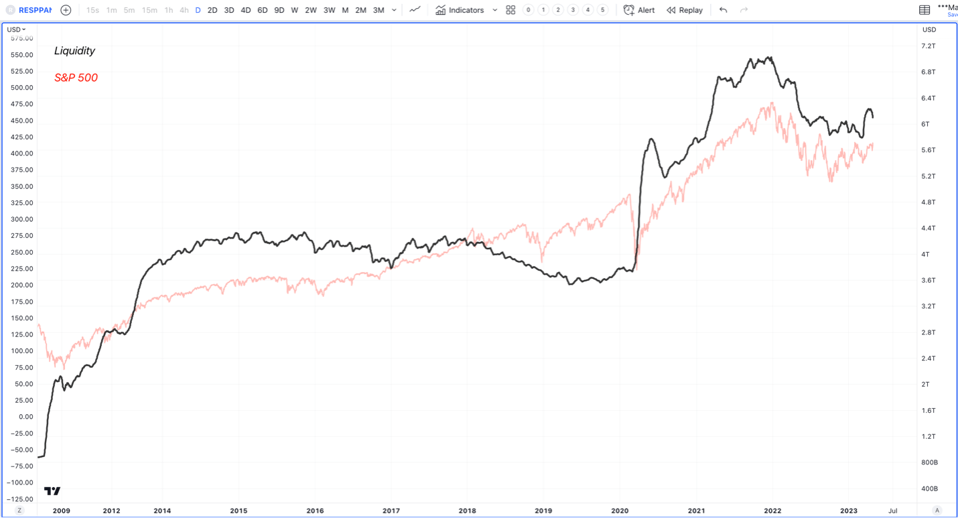
Source: I/O FUND
There has been a long-standing relationship to liquidity and asset prices, and until we can see a new liquidity cycle start, companies with cash will have better leverage over those that don’t. You can also expect volatility in the markets to remain high until there’s a new liquidity cycle, which we covered when we discussed where we hold cash.
The longer this plays out, the more ways Apple can leverage its $165 billion in cash as consumers will seek better financing terms, higher yields and credit lines will also increase.
For example, Apple recently launched a new high-yield savings account that offers a 4.15% interest rate, which is 10 times higher than the United States national average and 415 times higher than what Chase or Bank of America offers at 0.01%. Apple is also lending from its balance sheet for the first time ever through Apple Pay’s Buy Now and Pay Later product.
To illustrate how effective Apple’s move into finance tech has become, the cornerstone product, Apple Pay, currently has 75 percent adoption among iPhone users. This is up from 10% in 2016. In addition to taking on banks, Apple is also competing with Mastercard and Visa with features that allow merchants to use iPhones and iPads to send and receive payments. The long-term goal is to replace wallets with iPhones.
Apple has the best operating margin among the FAANG stocks at 30.7%. Net profit last quarter was $30 billion with free cash flow of also $30 billion.

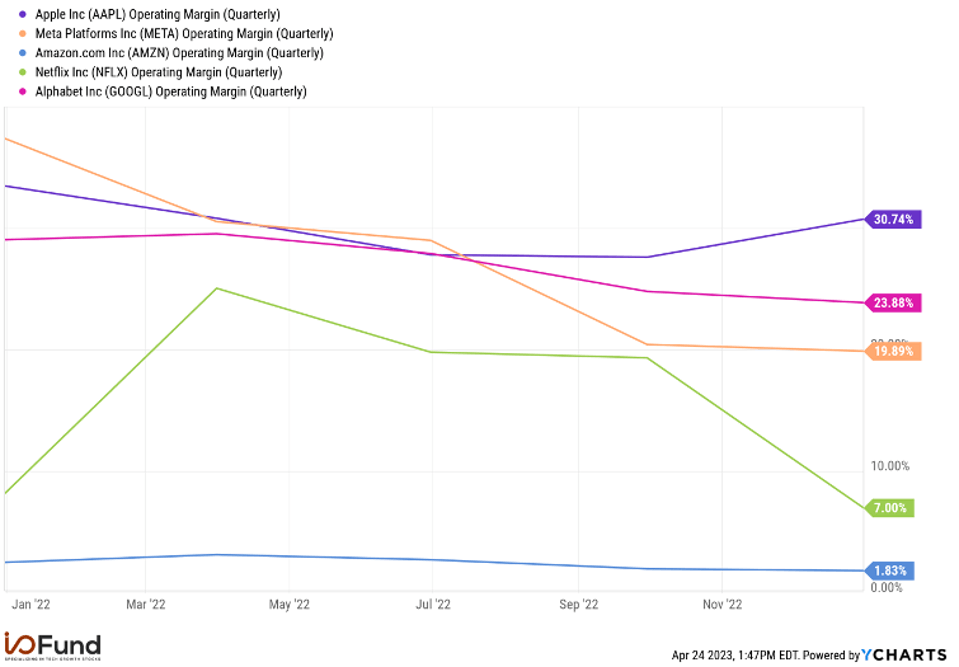
Source: I/O FUND
Apple is not immune to the effects felt across corporate bonds and mortgage securities. According to CNBC, the company has $13 billion in unrealized losses. These losses are not reported as long as Apple plans to hold to maturity, and as long as the bond issuers are solvent enough to repay the debt. Also, a loss of $13 billion is not detrimental to Apple, as the company generates $100 billion in free cash flow per year. Notably, the company used to have $250 billion in cash reserves before increasing buybacks in 2017.
Apple has debt of $111 billion for a net cash balance of $54 billion. The company paid $3.8 billion in dividends and equivalents and repurchased shares worth $19.5 billion.
Sign up for I/O Fund's free newsletter with gains of up to 221% - Click here
What to Watch for in Q1 Earnings
Apple is not a growth stock. The company is known for strong margins, outsized cash flows, and stable balance sheet. The company’s revenue has been partly negatively impacted from the adverse FX movements. Analysts expect revenue to decline by (4.6%) YoY to $92.81 billion yet the company’s revenue is expected to grow after the June quarter.

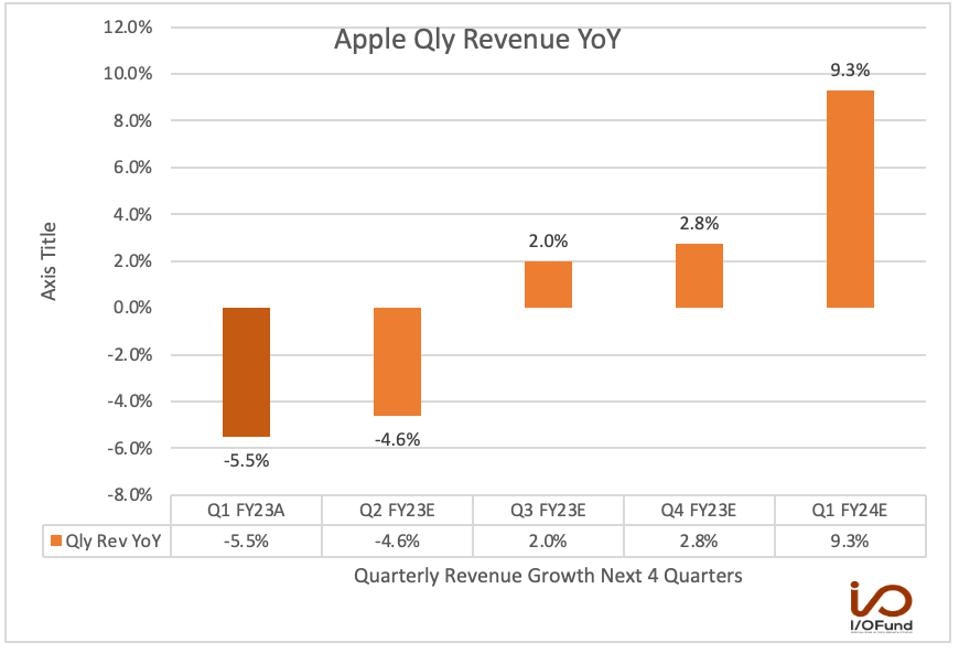
Source: SEEKING ALPHA
On a fiscal year basis, Apple is expected to report a rebound next fiscal year:

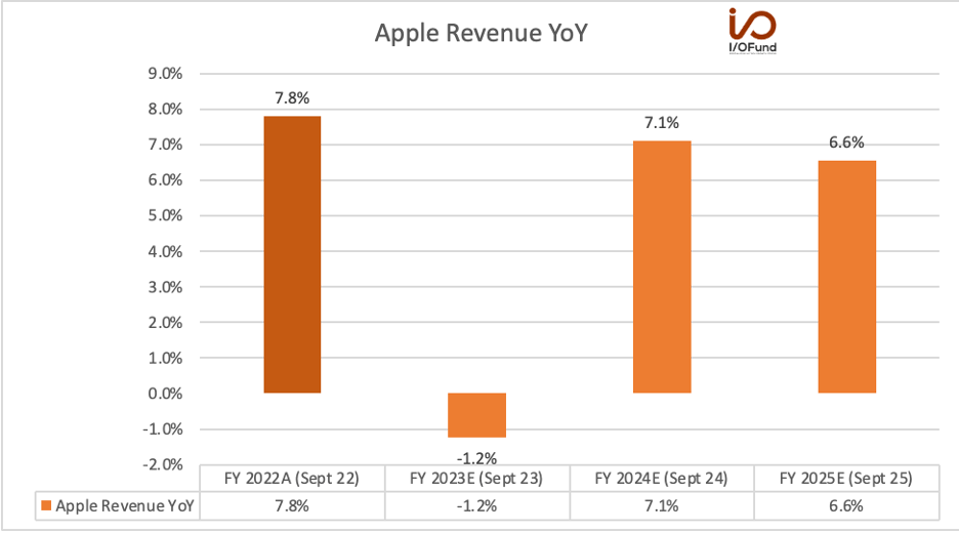
Source: SEEKING ALPHA
Apple has the highest operating margins among the FAANG stocks. For EPS, Apple is expected to report the following:

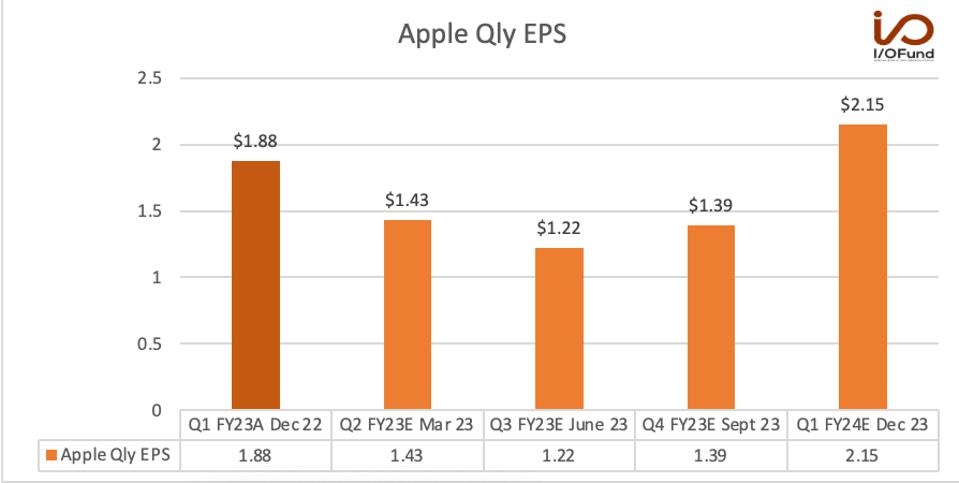
Source: YCHARTS
Apple’s main segments are iPhones, Macs, iPads, Wearables and Services. Of these, the Mac segment is dragging on Apple’s results. Last quarter, Mac sales declined by (29%) YoY to $7.7 billion. Management expects revenue to decline double digits due to challenging comparable with the M1 Mac Books from last year and a weaker consumer.
According to IDC, there was a YoY decline of (29%) in the shipments of traditional PCs in Q1 2023 due to weaker demand and excess inventory. The report from IDC suggests that Macs declined by (40%) in Q1 2023.
iPhone sales in the December quarter declined by (8%) YoY to $65.8 billion yet were flat excluding foreign exchange rates. Management expects revenue to accelerate in the March quarter when compared to the Dec quarter, per the earnings call: “For iPhone, we expect our March quarter year-over-year revenue performance to accelerate relative to the December quarter year-over-year revenue performance.”
According to the research firm Canalys, the global smartphone market declined by (13%) YoY in Q1 2023. The report from Canalys states that Apple gained 3% in global market share from 18% to 21% driven by the demand for iPhone 14 Pro series. Samsung was the only leading vendor to report QoQ growth and also regained the #1 position at 22% market share.
The Services segment is the second largest segment after iPhone. This is where payment services and loan products will show up. Many investors see this as the long-term opportunity as Apple is monetizing it’s installed base of over 2 billion active devices. The installed base grew by 8% YoY. Services revenue grew 6% YoY to $20.8 billion and grew double digits excluding foreign exchange rates.
The company has more than 935 million paid subscriptions, up 19% YoY. Per CFO, Luca Maestri, The growth is coming from every major product category and geographic segment, with strong double-digit increases in emerging markets such as Brazil, Mexico, India, Indonesia, Thailand and Vietnam.”
Big Tech is Propping up the Nasdaq
In the early phase of a bull market, we tend to see expansive buying amongst most sectors and markets, with a relative focus in your economically sensitive sectors like small caps and high beta names. This is simply not the case right now. In fact, what we are seeing is a handful of big tech names propping up the markets. Meanwhile, underneath this, economically sensitive stocks are getting aggressively sold while Big Tech props up the market.

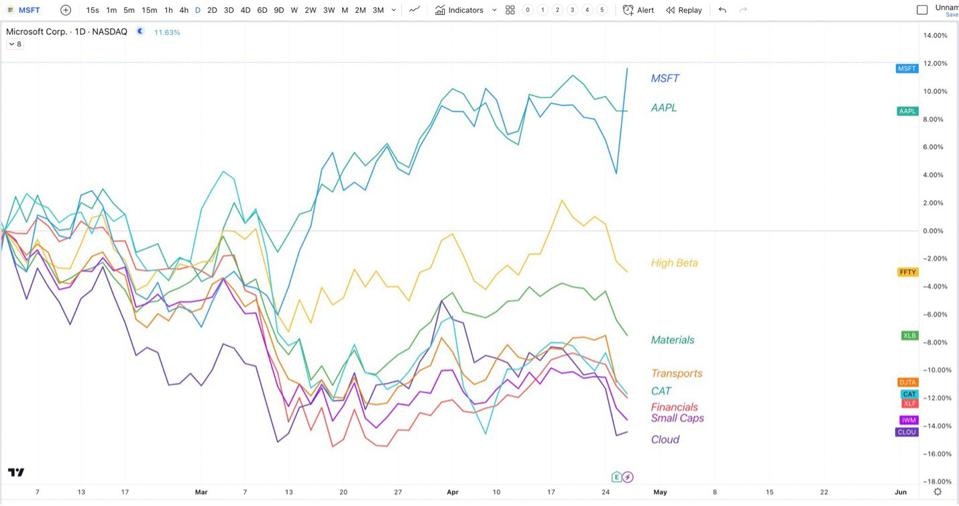
Source: I/O FUND
Furthermore, the percentage of Microsoft and Apple’s combined weighting in the S&P 500 has never been higher. The S&P 500 weighting is according to market cap, which is price times float. The longer buying happens in these two names, accompanied with selling in other areas of the index, the percentage weighting becomes stretched to unhealthy extremes. This is not characteristic of a burgeoning bull market; instead, it is the type of behavior we see at market tops.
Regarding Apple’s price chart, we believe that the bounce off the October 13th low in 2022 is starting to top out.

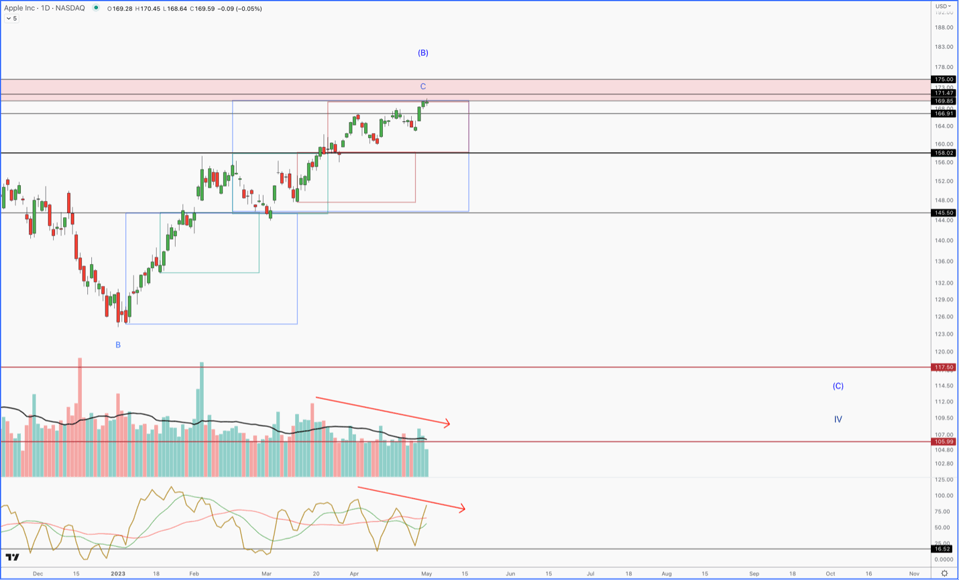
I/O FUND
We have been talking about the $169-$170 price target for many months in our premium service. Now that we are here, you can see how the market is trying to push higher on weaker volume and weaker momentum. We could see a push to the $175 region in this final push higher, but soon, AAPL will have to correct. If the structure of this correction is a 5 wave decline, then we will be targeting new lows. On the other hand, if this pullback is a 3 wave move, we could see a move back to the $145 region only, before a fresh attempt higher is made.
Every Thursday at 4:30 pm Eastern, the I/O Fund team holds a webinar for premium members to discuss how to navigate the broad market, as well as various stock entries and exits. We offer trade alerts plus an automated hedging signal. The I/O Fund team is one of the only audited portfolios available to individual investors. Learn more here.
Note on Valuation:
Apple is trading at a premium with a current PE ratio of 28. The stock does not tend to hold well at a PE ratio of 30.

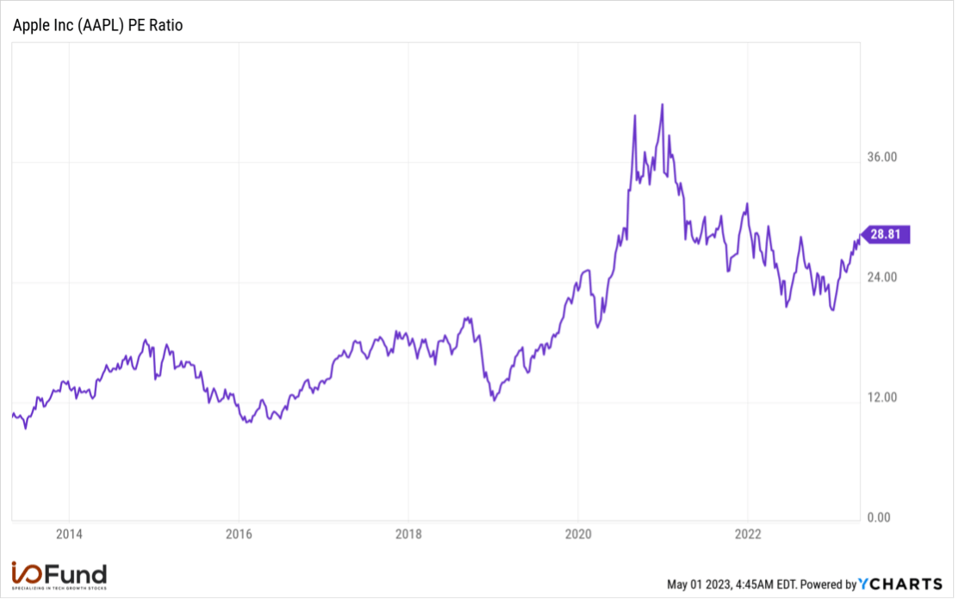
Source: I/O FUND
The forward PE Ratio of 28 is also stretched and does not hold well at this level historically.

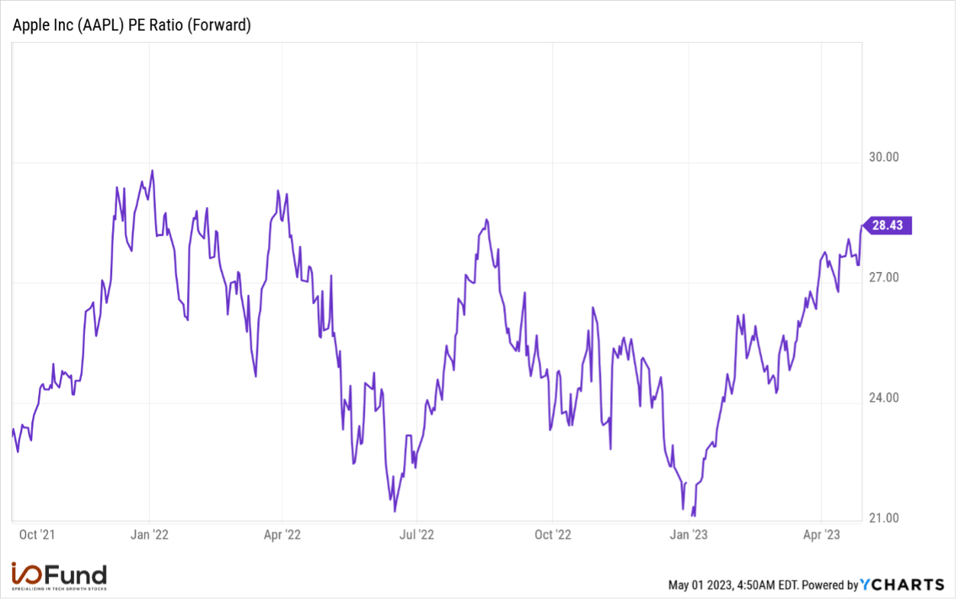
Source: I/O FUND
Conclusion:
Apple is the most likely candidate to disrupt the financial sector. The company’s reach of 2 billion devices has assisted its slow roll-out of payment services with 75% of iPhone users opting into Apple Pay. One can only imagine the potential success Apple may have in leveraging its cash for higher yields during a time when banks are weak in reputation and balance sheets.
In the upcoming earnings report, expect weakness in Macs to overshadow the other segments. iPhones are expected to be flat yet the Services segment is where fintech growth will show up. Overall, this is unlikely to be a standout quarter for Apple on the top line, so look for surprises on the bottom line to drive the stock.
We have Buy levels we are targeting for Apple, which we share with our premium research members each week as the stock progresses. We believe our target buy level will set us up for gains in Apple’s stock when the next bull cycle begins. We provide in depth macro and individual stock analysis so that readers can better understand why we buy/sell. In this market, we frequently take gains.
We also issue real-time trade alerts when we enter and exit stocks. YTD, our firm has held the two top performing assets in the tech industry – Nvidia and Bitcoin — at high allocations. We also issued a buy alert with NVDA last year at $108 and with Bitcoin in the $16,000 region, based on the type of analysis we provide. You can learn more here including information on our next webinar, this Thursday at 4:30 pm Eastern, where we review our positions live.
Portfolio Manager Knox Ridley and Equity Analyst Royston Roche contributed to this article.
Please note: The I/O Fund conducts research and draws conclusions for the Fund’s positions. We then share that information with our readers. This is not a guarantee of a stock’s performance. Please consult your personal financial advisor before buying any stock in the companies mentioned in this analysis.
Recommended Reading:


More To Explore
Newsletter

Nvidia and Google Are Crowding TSMC’s N3 Node - Can Intel Fill the Gap?
Nvidia is moving its next-generation Rubin GPUs from 4nm to 3nm, yet Google’s latest TPUs are already on N3 and are expected to remain there. Meanwhile, a growing number of AI CPUs from Nvidia, Amazon

Intel vs TSMC: How CoWoS Packaging Constraints Could Create an Opportunity for Intel Foundry
Taiwan Semiconductor (TSMC) is the single, most important company to the AI industry. However, to compete with the incumbent, Intel does not need to beat TSMC at leading-edge manufacturing. It only ne

Big Tech’s Free Cash Flow is Turning Negative – Who's Next?
Big Tech’s AI revenue is accelerating, but free cash flow is moving sharply in the opposite direction. Across Google, Microsoft, Meta and Amazon, capex is rising much faster than operating cash flow a
Big Tech Earnings Preview: Is AI Monetization Finally Catching Up to Capex?
The most pronounced difference between 2026’s tech rally compared to rallies in the past is which companies have been left out of it. The names most associated with the AI trade have hardly participat
Nvidia, CXL, and the Battle to Improve AI Inference Economics
This is Part 2 of our two-part series on AI inference economics. In Part 1 — Why Nvidia's Next AI Battle Is About Tokens per Watt, we laid out why tokens per watt has become the defining metric for in
Why Nvidia’s Next AI Battle Is About Tokens per Watt
As hyperscalers move from building AI infrastructure to monetizing it, tokens per watt helps to reflect if revenue is scaling and if profitability is improving. Offload engines can increase tokens per

Micron Is Up 900%. Here’s Why the AI Memory Trade May Still Have Room to Run
Over the past 10 months, memory chip stocks have gone from being solid beneficiaries of the AI boom to capturing a massively outsized piece of the return pie. The inflection in Micron’s performance de

Why the S&P 500 Shrugged Off the Iran War — and What Could Finally Break the Rally
On February 28th, the U.S. went to war with Iran, and the market was handed the kind of shock it hasn't contended with for years. The conflict set off a chain reaction across the region: an ongoing su

Nvidia, CoreWeave, and Nebius: Inside the Circular Financing of the GPU Boom
Neoclouds are one of the more hotly debated AI business models, with CoreWeave and Nebius being the two most widely recognized names. These companies have seen their sales, backlog, and share prices s

AMD, Nvidia, Arm, Intel: Inside the $120 Billion CPU Gold Rush
CPUs have gone from an afterthought to becoming the AI trade’s next great bottleneck – and with AMD, Nvidia, Arm and Intel circling a market that is doubling nearly overnight, the only question left i
