Meta Stock Emerges as a Strong Mag 7 AI Leader
September 25, 2025

Beth Kindig
Lead Tech Analyst

The AI frenzy has investors fixated on revenue growth as proof of returns on AI spending that can be as high as $100 billion per year, depending on the company. Yet, Meta is proving that a stronger signal of AI strength may be found further down the income statement — in the bottom line.
Without much fanfare, Meta put up a solid earnings report this past quarter as ad impressions rebounded to 11% up from 5% growth; this is a critical metric for the company as management must prove they are reaping the rewards of large capex spending. However, it’s also clear the large capex spend is impacting the bottom line as the company beat by 22% for growth of 38.4%. When adding back the $0.52 tailwind from increasing the useful life of servers, EPS beat by 11.2%.
There is evidence that both the top line and bottom line can continue to improve as Meta quietly asserts its AI strength come 2026. This quarter, average revenue per person (ARPP) is showing initial signs of bottoming with an important uptick YoY that was absent last quarter when ARPP declined YoY. Secondly, Meta has indicated their internal AI operations will result in lower headcount come 2026 as AI reaches the capabilities of a mid-level software engineer. Combined with a potential inflection point in their ad business, that indicates strong double digit EPS growth will continue in 2026.
Accelerating Growth in Core Business – Largest Beat in Nearly 4 years
Revenue for the quarter came in at $47.5 billion, beating consensus by $3 billion. While a 5% top-line beat may seem modest at first glance, this was Meta’s largest revenue surprise in 15 quarters. When removing one-time adjustments, EPS beat by 11%, or nearly double the beat seen on the top line.


Meta’s year-over-year revenue growth shows acceleration from 16% in Q1 FY25 to 21.6% in Q2 FY25, with projections for continued growth above 20% into Q3 FY25.
This quarter’s performance stands in sharp contrast to Q1, when revenue grew a modest 16% YoY, with just a $1 billion beat, and ad impressions were up a muted 5%. In other words, Q2 wasn’t just another incremental improvement, it was a potential inflection point that reset expectations for the back half of the year. It may have also signaled that Meta’s core advertising engine could renew its upward trajectory from the impact of its AI investments.
Looking ahead, Q3 guidance calls for revenue between $47.5 billion and $50.5 billion, implying another quarter of ~21% YoY growth at the midpoint. If the Company can continue to deliver back-to-back quarters of >20% growth, this should put the narrative of slowing growth in the rearview.
Sequential Improvement in Margins, up 5 points YoY
Revenue grew 16% YoY, the slowest rate since Q2 2023 as Meta lapped tough comps. Ad impressions growth decelerated to 5%, with all regions slowing sharply.


Meta’s operating margin expanded five points year-over-year, rising from 38% in Q2 FY24 to 43% in Q2 FY25, highlighting stronger profitability trends.
Ad impressions rebounded to 11% YoY, more than doubling sequentially. APAC led the way with +16% impressions growth, while US & Canada improved significantly, climbing to +9% from just +4% in Q1. Ad pricing remained firm at 9% YoY, a slight deceleration from Q1 but notable given the acceleration in impressions.
AI at the Core of Ad Re-Acceleration
The key driver behind this resurgence is Meta’s aggressive deployment of AI to improve ad efficiency and user engagement. Management highlighted recent upgrades to its ad recommendation system, which now leverages more signals and longer context windows to drive higher performance.
These improvements had tangible effects in Q2. Ad conversions increased ~5% on Instagram and ~3% on Facebook, reflecting the system’s ability to better match advertisers with the right audiences. Time spent also improved meaningfully, rising 5% on Facebook and 6% on Instagram, which expands available inventory.

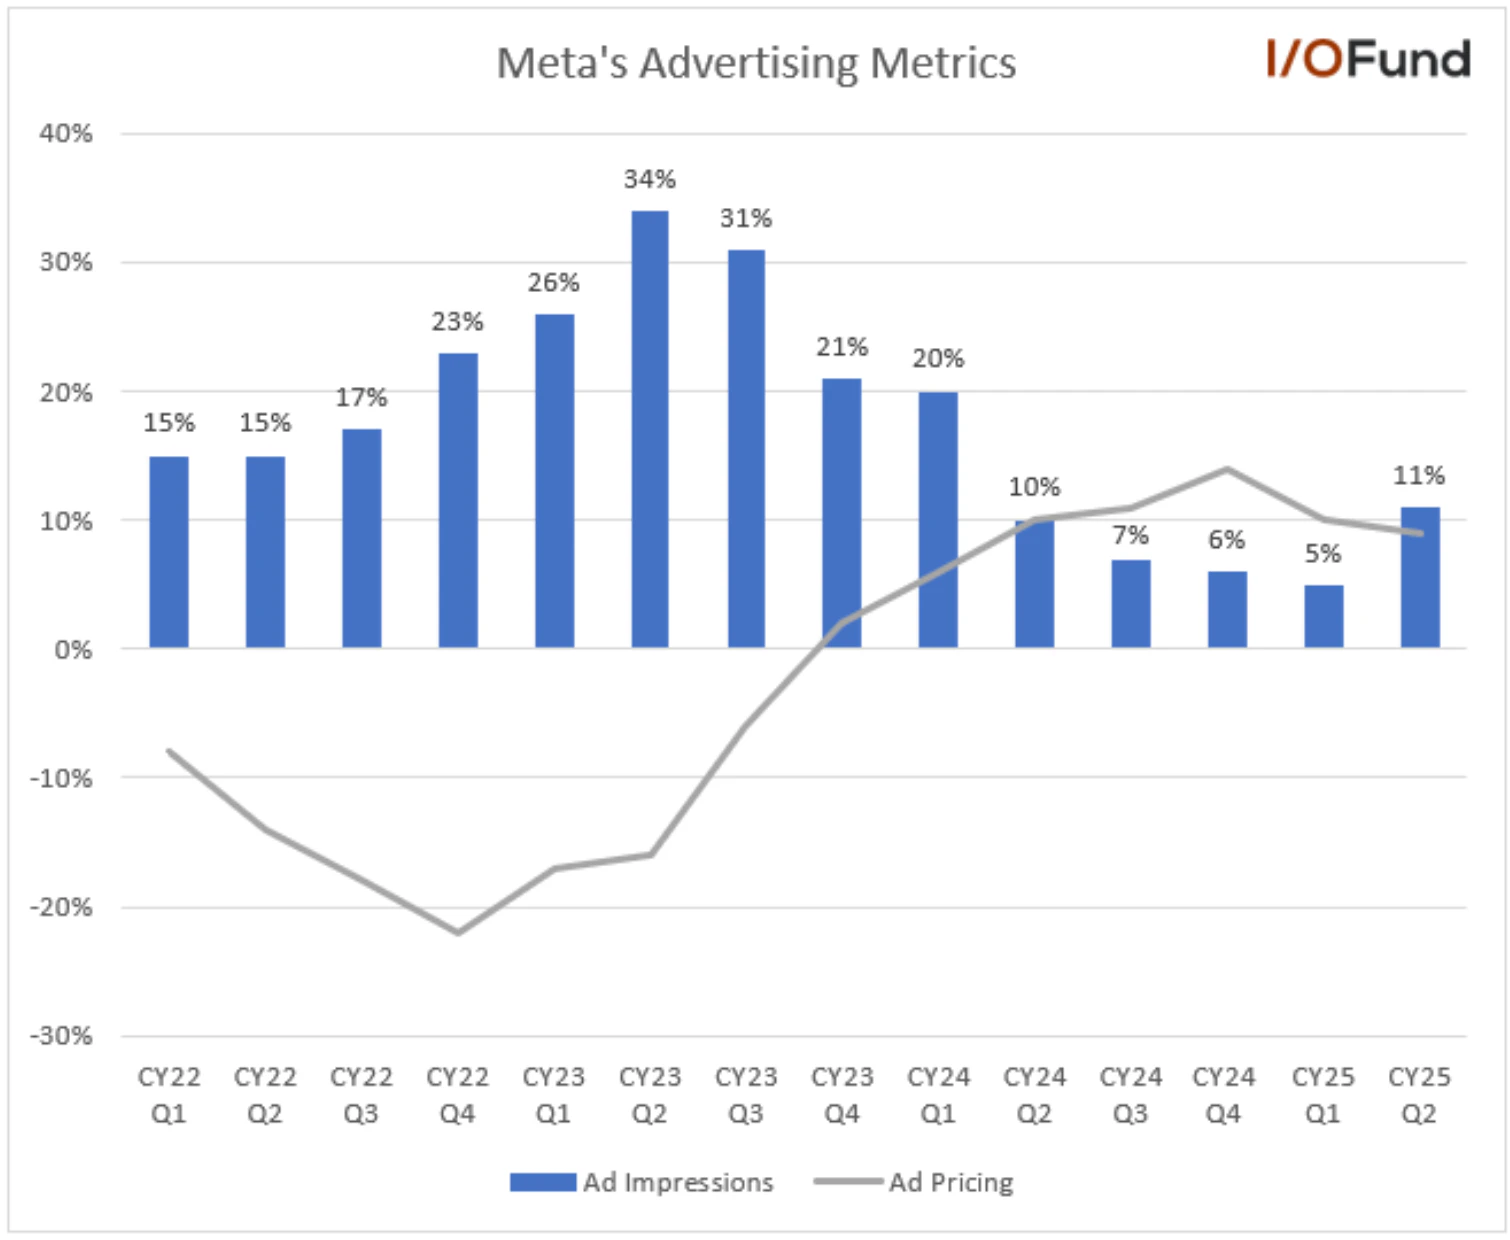
Meta Q2 2025 Ad Impressions Surge: Significant Quarter-over-Quarter Growth Highlights Strong Performance
This dynamic showed up clearly in Meta’s performance metrics. The rebound in ad impressions from +5% in Q1 to +11% in Q2 was the sharpest sequential improvement over a year, driven by strength across regions, particularly in APAC. Despite this surge in volume, pricing held firm, increasing 9% YoY, just a modest deceleration from the prior quarter’s 10% growth. This stability indicates advertisers are seeing higher value per impression, thanks in large part to AI-driven performance gains.
ARPP also benefitted from these trends, climbing nearly $2 year over year to $13.65, just shy of Q4’s record $14.25. This suggests advertisers aren’t just buying more impressions, they’re paying more for better-performing ones.
At the center of this success is Advantage+, Meta’s flagship AI ad platform. Advantage+ automates campaign targeting, budget allocation, and creative generation, providing advertisers with a powerful easy-to-use tool that integrates generative AI directly into Meta’s ad ecosystem. The results speak for themselves: Advantage+ is now operating at a $20 billion annual run rate, up 70% YoY.
Advertisers using Advantage+ report up to 22% improvements in returns on ad spend (ROAS), and adoption continues to climb, with more than 4 million advertisers now using at least one generative AI creative tool.
According to the most recent earnings call, management stated why they are seeing such rapid growth: "studies show that for every dollar spent with our AI-enabled Advantage+ products, advertisers generate on average $4.52 in revenue for their businesses.”
Why Meta’s AI Story Stands Apart
Sign up for free to receive the following information:
- The one simple reason that Meta could see a stronger 2026 than currently anticipated
- Whether Meta’s high capex of $100B run rate is a boon for future growth or a concern for investors to watch out for
- Looking beyond revenue, what line item we are watching for weakness in 2026 and what needs to happen to offset this


More To Explore
Newsletter

Token Growth is Surging - Here Are the Beneficiaries
The reality of AI demand growth has shattered early estimates for token processing, yet expectations continue moving up and to the right. In the second installment of our token processing series, we e

AI Token Demand is Shattering Forecasts
Total annual token processing is no longer measured in billions or trillions of tokens, but in the quadrillions and beyond. As annual token processing is now tracked in units with 15 trailing zeros, i

Nvidia and Google Are Crowding TSMC’s N3 Node - Can Intel Fill the Gap?
Nvidia is moving its next-generation Rubin GPUs from 4nm to 3nm, yet Google’s latest TPUs are already on N3 and are expected to remain there. Meanwhile, a growing number of AI CPUs from Nvidia, Amazon
Intel vs TSMC: How CoWoS Packaging Constraints Could Create an Opportunity for Intel Foundry
Taiwan Semiconductor (TSMC) is the single, most important company to the AI industry. However, to compete with the incumbent, Intel does not need to beat TSMC at leading-edge manufacturing. It only ne
Big Tech’s Free Cash Flow is Turning Negative – Who's Next?
Big Tech’s AI revenue is accelerating, but free cash flow is moving sharply in the opposite direction. Across Google, Microsoft, Meta and Amazon, capex is rising much faster than operating cash flow a
Big Tech Earnings Preview: Is AI Monetization Finally Catching Up to Capex?
The most pronounced difference between 2026’s tech rally compared to rallies in the past is which companies have been left out of it. The names most associated with the AI trade have hardly participat

Nvidia, CXL, and the Battle to Improve AI Inference Economics
This is Part 2 of our two-part series on AI inference economics. In Part 1 — Why Nvidia's Next AI Battle Is About Tokens per Watt, we laid out why tokens per watt has become the defining metric for in

Why Nvidia’s Next AI Battle Is About Tokens per Watt
As hyperscalers move from building AI infrastructure to monetizing it, tokens per watt helps to reflect if revenue is scaling and if profitability is improving. Offload engines can increase tokens per

Micron Is Up 900%. Here’s Why the AI Memory Trade May Still Have Room to Run
Over the past 10 months, memory chip stocks have gone from being solid beneficiaries of the AI boom to capturing a massively outsized piece of the return pie. The inflection in Micron’s performance de

Why the S&P 500 Shrugged Off the Iran War — and What Could Finally Break the Rally
On February 28th, the U.S. went to war with Iran, and the market was handed the kind of shock it hasn't contended with for years. The conflict set off a chain reaction across the region: an ongoing su
