The Fed Can’t Save This One: Why Bonds May Break the Stock Market in 2025
April 11, 2025

Knox Ridley
Portfolio Manager

Last February the S&P 500 was nearing all-time highs and exuberance could be felt throughout the market with crypto leading the way. Going against popular opinion, we stuck our neck out in the analysis: “AI Stocks Signal a Correction Before a Buying Opportunity Emerges” to state:
“While the market continues to push higher, it has been doing so without the support of key stocks and important sectors. As we’ve seen in times past, while this divergence can go on for a while, unless it invalidates with all sectors and stocks breaking to new highs, it tends to act as a warning. With money managers and retail investors all-in on stocks, it appears that the stage is being set for a potential rug pull this year.”
We went on to say that we have set up “aggressive buy targets” in key AI names, and that this period of volatility could set up a great buying opportunity. February wasn’t the first that we discussed this strategy, rather on January 1st – before DeepSeek or tariffs, we stated Nvidia’s next price target was between $102 - $83, causing us to cut more than half pf our position at $140 and $126 in February.
This past month, we have been following our buy plan, using some of the 50% cash we raised in December of 2024, as we expect a sizable bounce. From what we know today that bounce should be used to de-risk, although this ultimately needs to be assessed when we reach key levels.
With all major indexes in a technical bear market, and sentiment readings at historically low levels, most readers want to know if this is a generational buying opportunity, or are we setting up for lower levels in the coming weeks to months? Sentiment suggests that, even in the worst-case scenario, we should see a sizable bounce. However, with the shifting geo-political landscape, and especially the reaction in the bond market, we have shifted our stance to using the coming bounce to de-risk as there is the potential for a much larger bear market than what is currently priced in.
Why Bonds Matter
The trade war is taking center stage, and for good reason. Liberation day shocked the markets in the scope and severity of tariffs imposed on foreign nations, leading to one of the most extreme 3-day drops in market history. The tariffs and what this will mean for earnings and domestic growth is causing a level of uncertainty rarely seen in public markets.
While the masses are focused on the potential resolution and what will happen if we do not see one, there is a more immediate problem – no one is buying government bonds despite growth slowing down in the economy. This is not normal behavior and will become a problem if not resolved. Yields are too high for new bonds being issued, whereas the US government needs lower yields to finance the breathtaking amount of debt coming due this year.
In our October report, we quickly pointed out the unusual reaction bonds had to the FED’s surprise 50 bps cut. Bonds began dropping with rates, which are continuing to play out into today. Historically, bonds tend to go up (yields down) when the FED begins a rate cutting cycle.
The rationale is that the FED is cutting because they see growth and inflation slowing. If demand slows in the economy, prices drop to meet that demand, both in goods and services, as well as stocks. This is the type of environment investors would want to own a fixed yield coupled with the perceived safety found in Treasuries.
Join thousands of investors who trust I/O Fund’s expert stock analysis on AI, semiconductors, cryptocurrency, and adtech — sign up for free! Click here!
This logic is also why bonds went into a bear market in 2022 with stocks. In a rising inflation environment, where prices are going up, owning a fixed yield is not ideal, as the purchasing power of that fixed yield will diminish each year.
Aside from 2022, the inverse correlation between stocks and bonds has been a market axiom dating as far back as 1998. When growth is expected to slow, stocks tend to peak, and bonds go higher.
2008

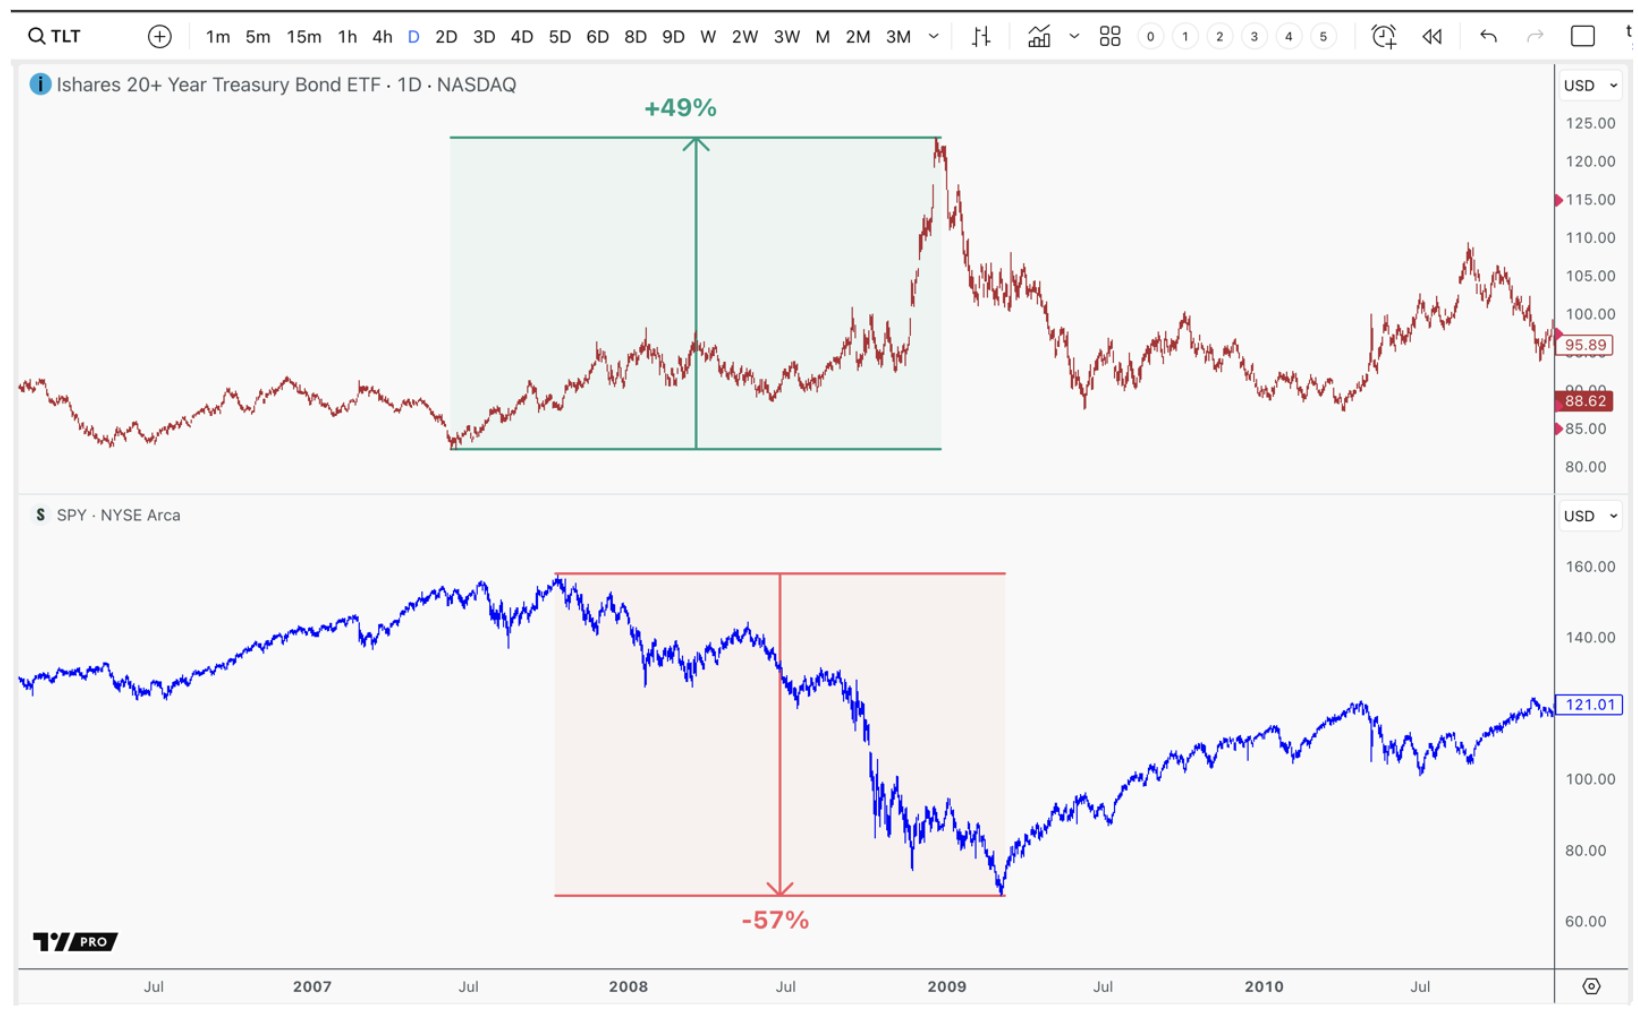
Treasuries bonds moved higher as stocks moved lower in 2008. This has been a 25-year pattern, as investors seek a safe, fixed yield in an environment where prices go lower.
2010

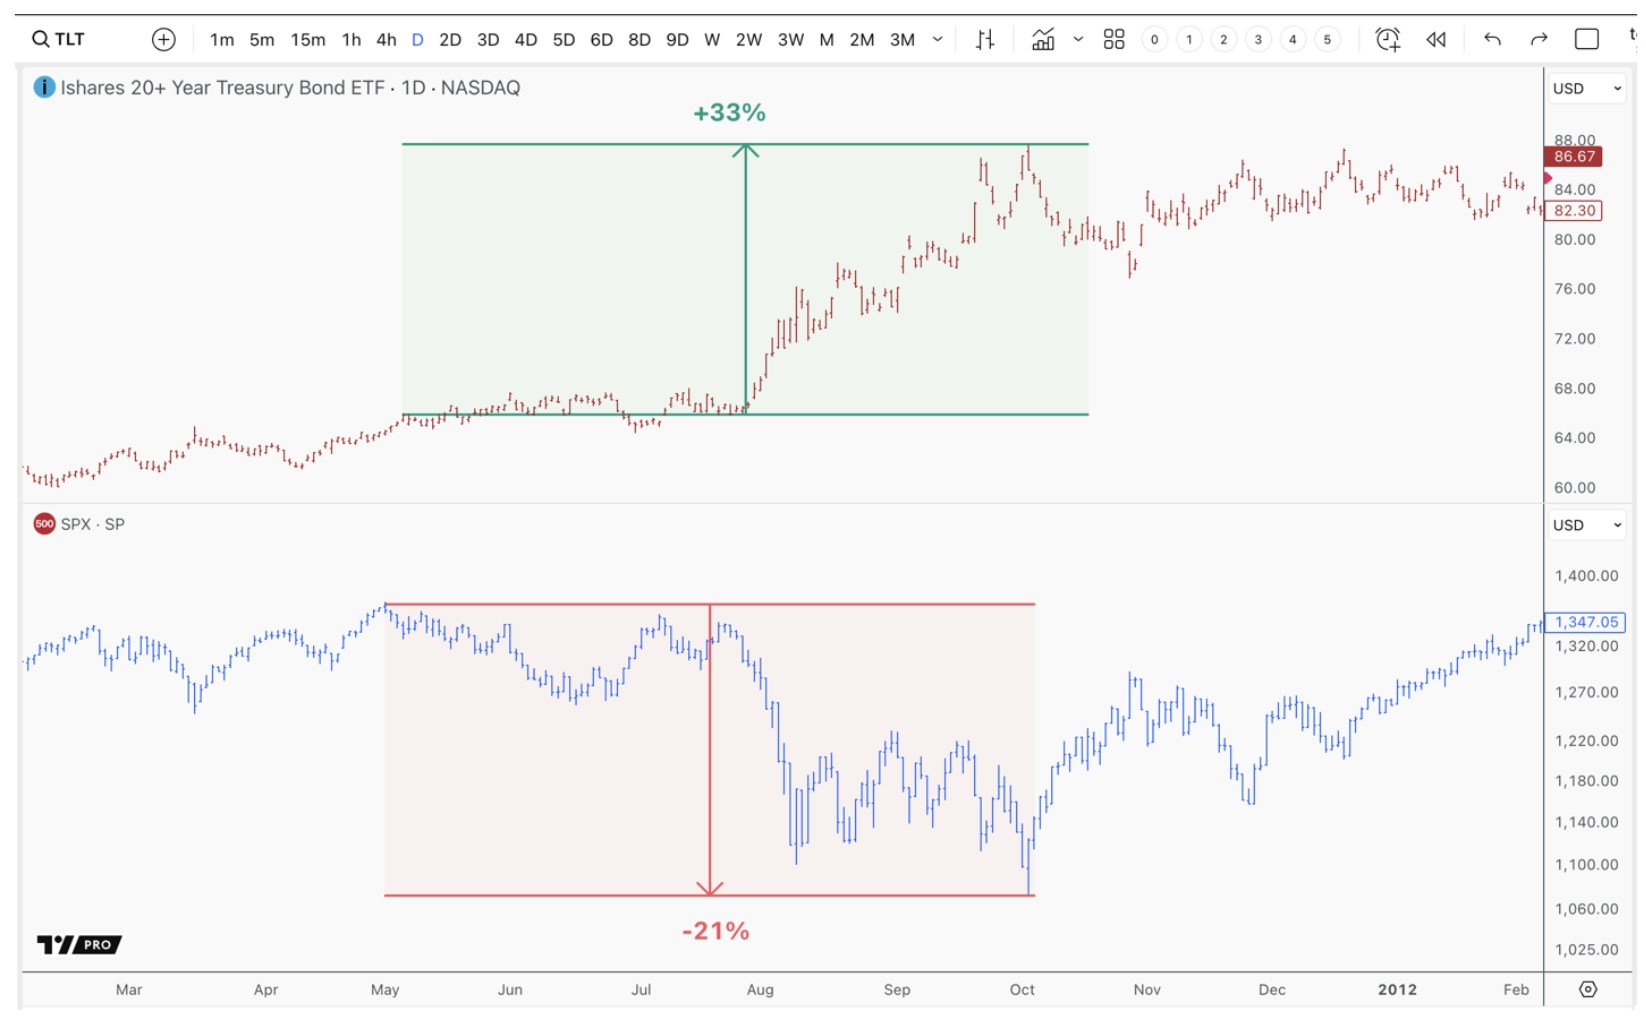
Treasuries bonds moved higher as stocks moved lower in 2010. This has been a 25-year pattern, as investors seek a safe, fixed yield in an environment where prices go lower.
2015

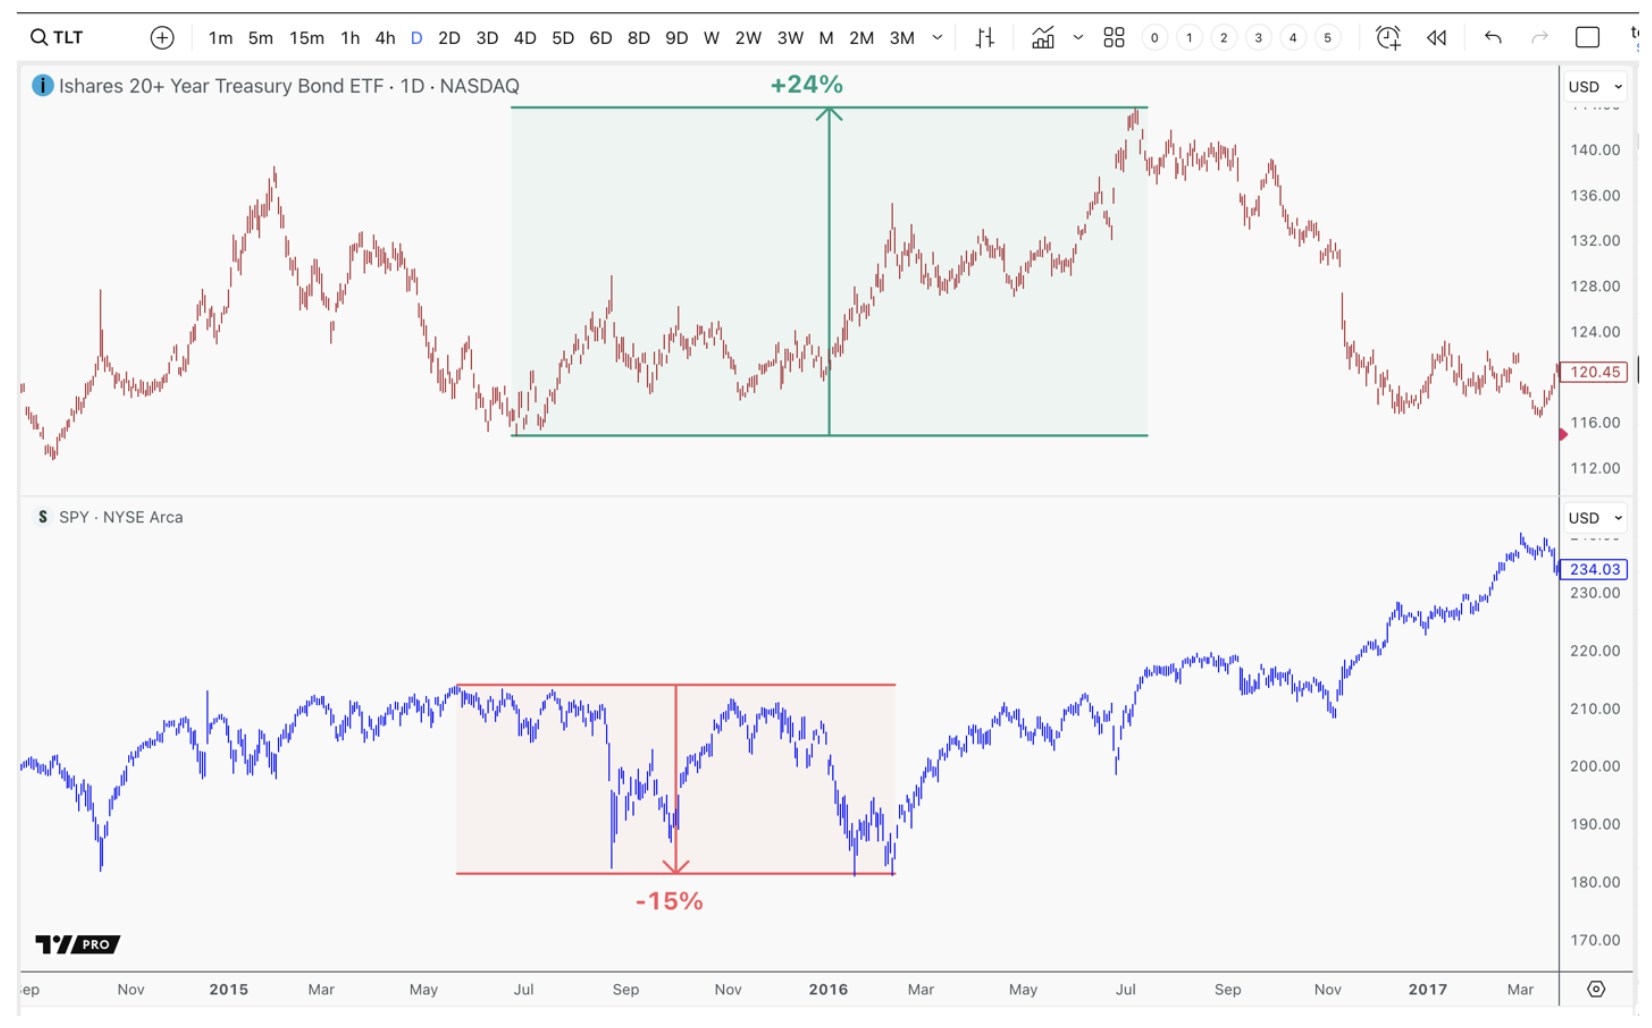
Treasuries bonds moved higher as stocks moved lower in 2015. This has been a 25-year pattern, as investors seek a safe fixed yield in an environment where prices go lower.
2018

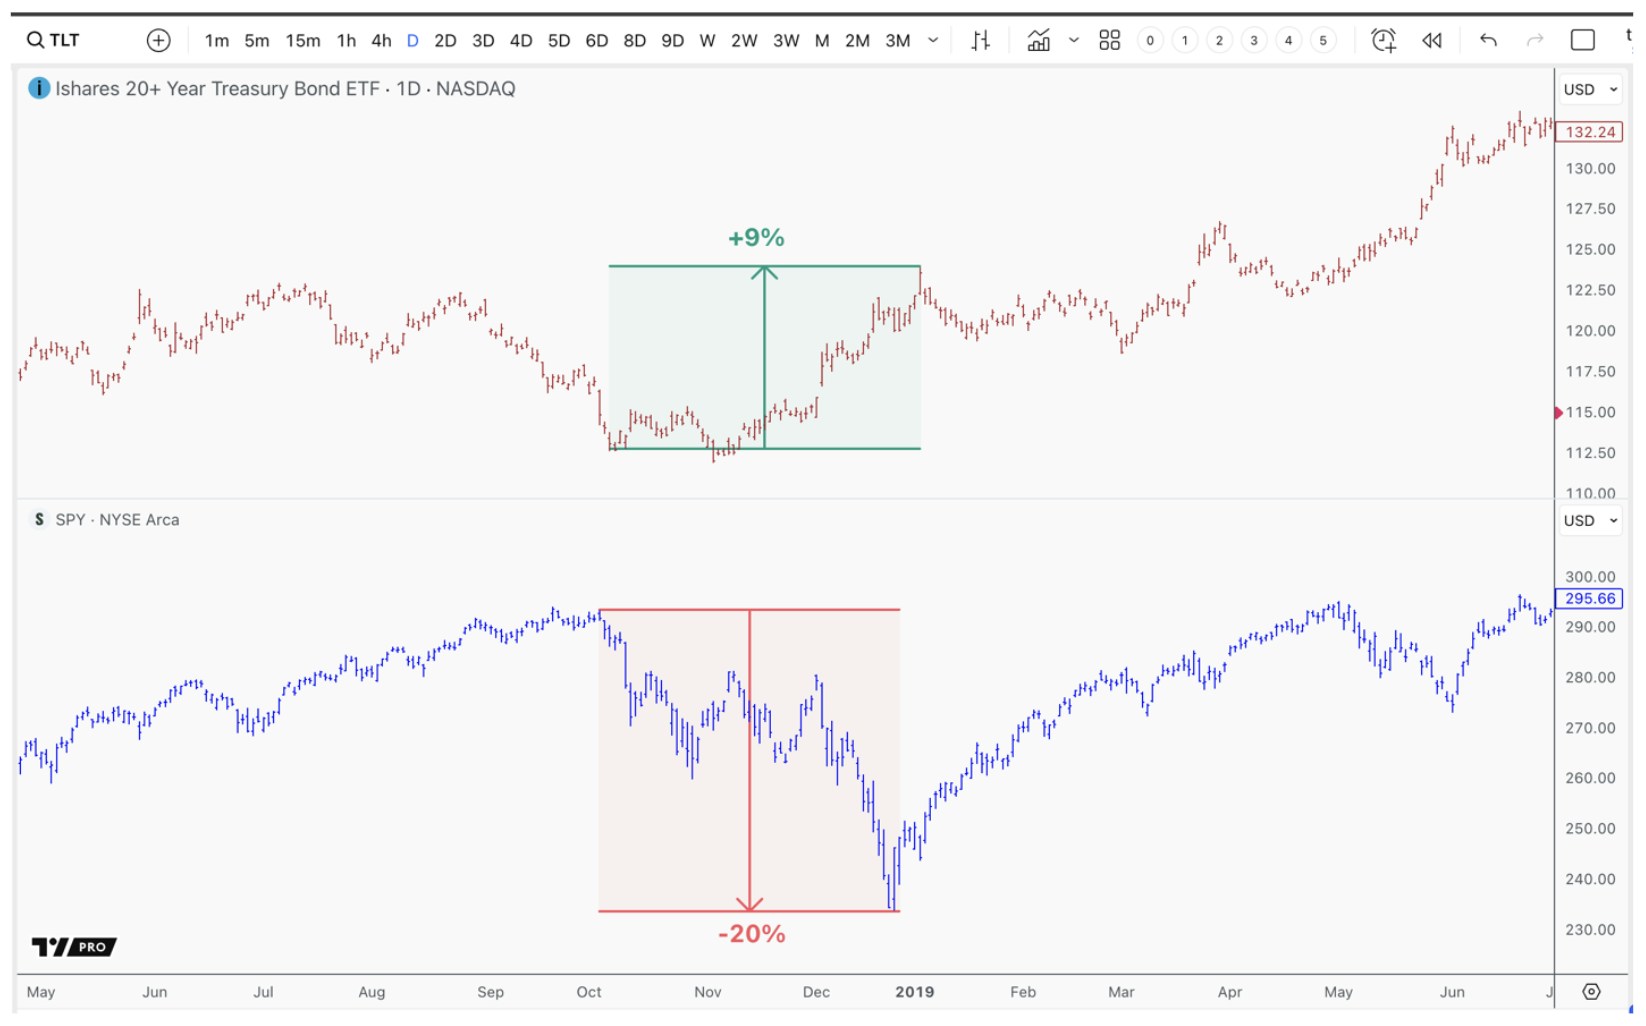
Treasuries bonds moved higher as stocks moved lower in 2018. This has been a 25-year pattern, as investors seek a safe, fixed yield in an environment where prices go lower.
2020

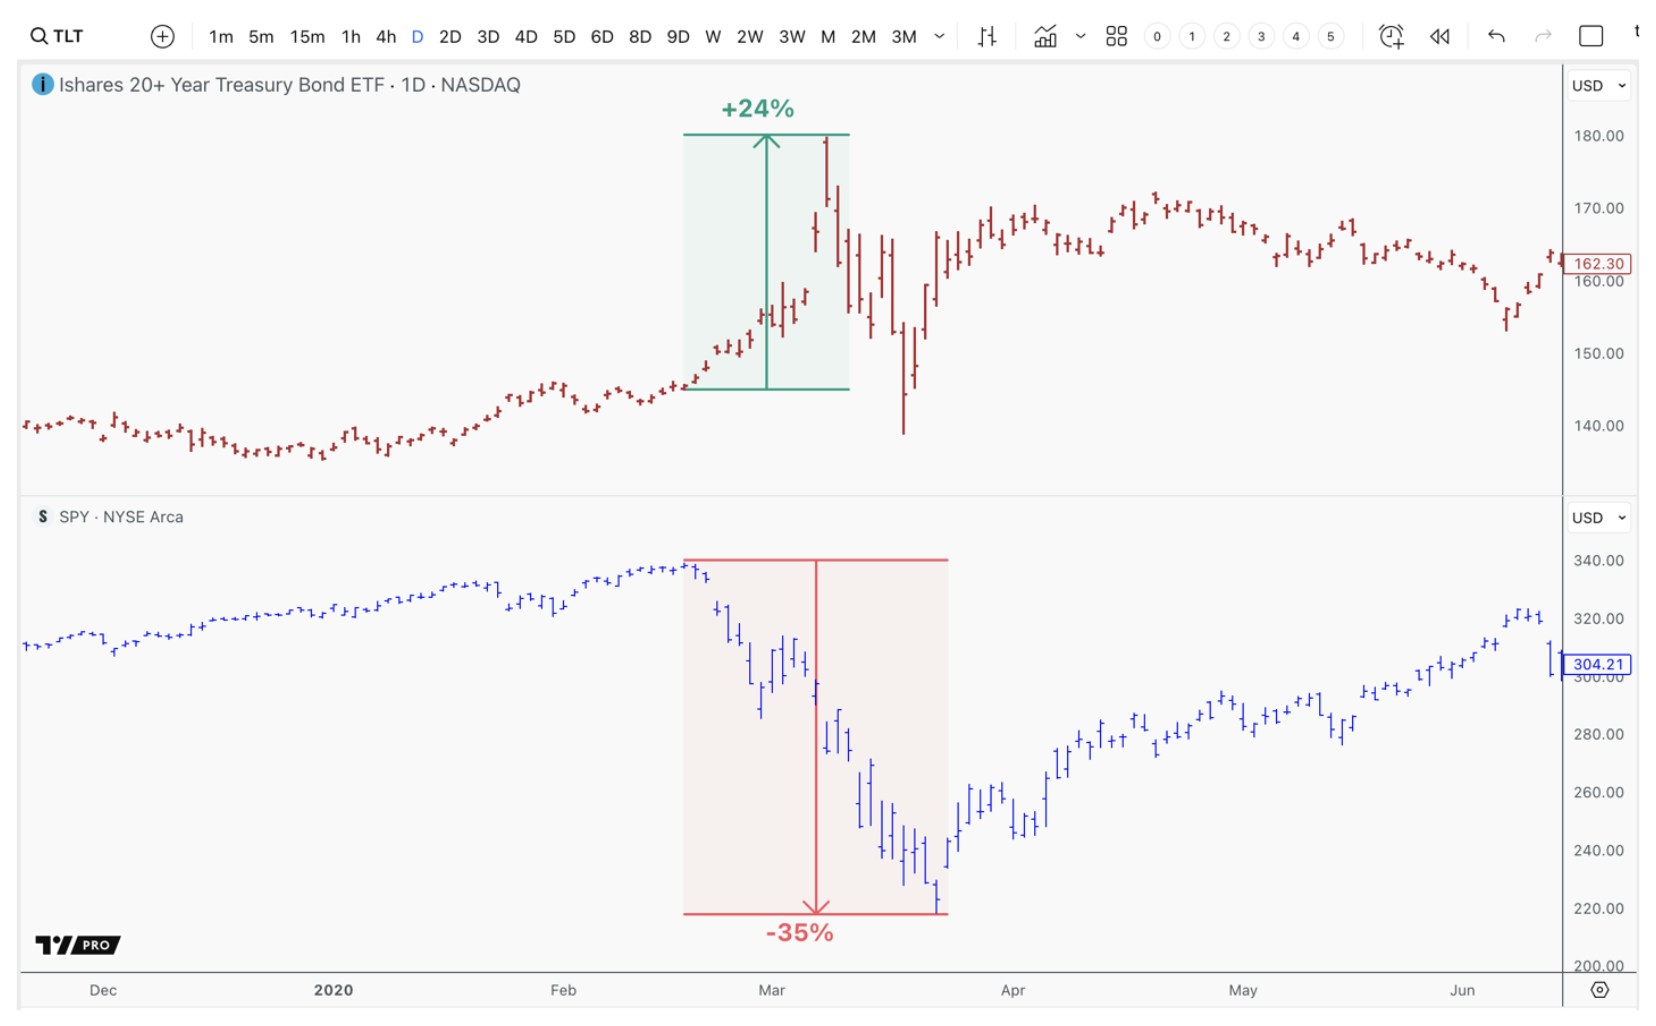
Treasuries bonds moved higher as stocks moved lower in 2020. This has been a 25-year pattern, as investors seek a safe, fixed yield in an environment where prices go lower.
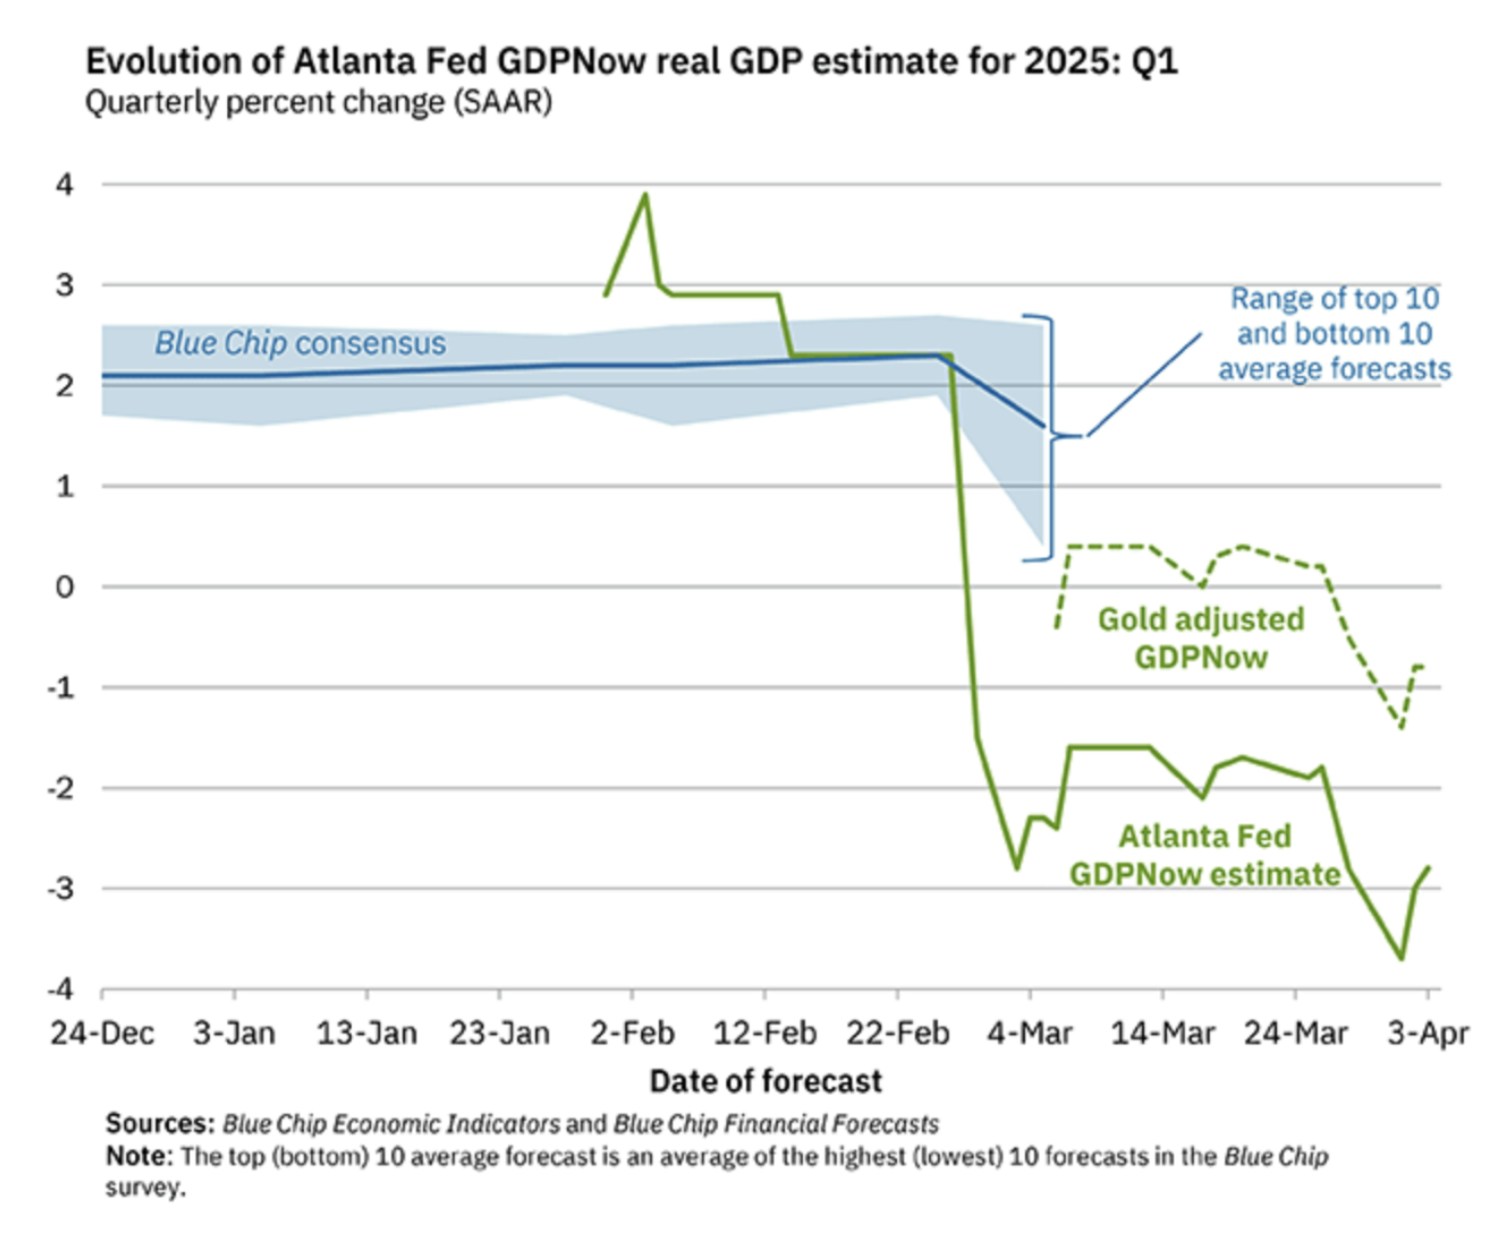
Regarding today’s environment, we are seeing all major indexes in bear market territory, while GDP projections are trending deeper into negative territory. The Atlanta GDP Now forecast went from +2% forecasted for Q1 of 2025 to -3% in just under 2 months.

Furthermore, Goldman Sachs raised their odds of a recession in 2025 to 45%, while the odds on most major betting platforms have a recession at 60%. These odds have backed off somewhat due to the erratic news surrounding the Trade War, yet they remain uncomfortably elevated by historic standards.
This is being confirmed with the Oil markets breaking down from a 3-year range, which has moved sharply lower and appears to be confirming a new downtrend. As the global demand for oil is fading, this is signaling the likelihood of a notable slowdown in global growth, not just in the U.S.

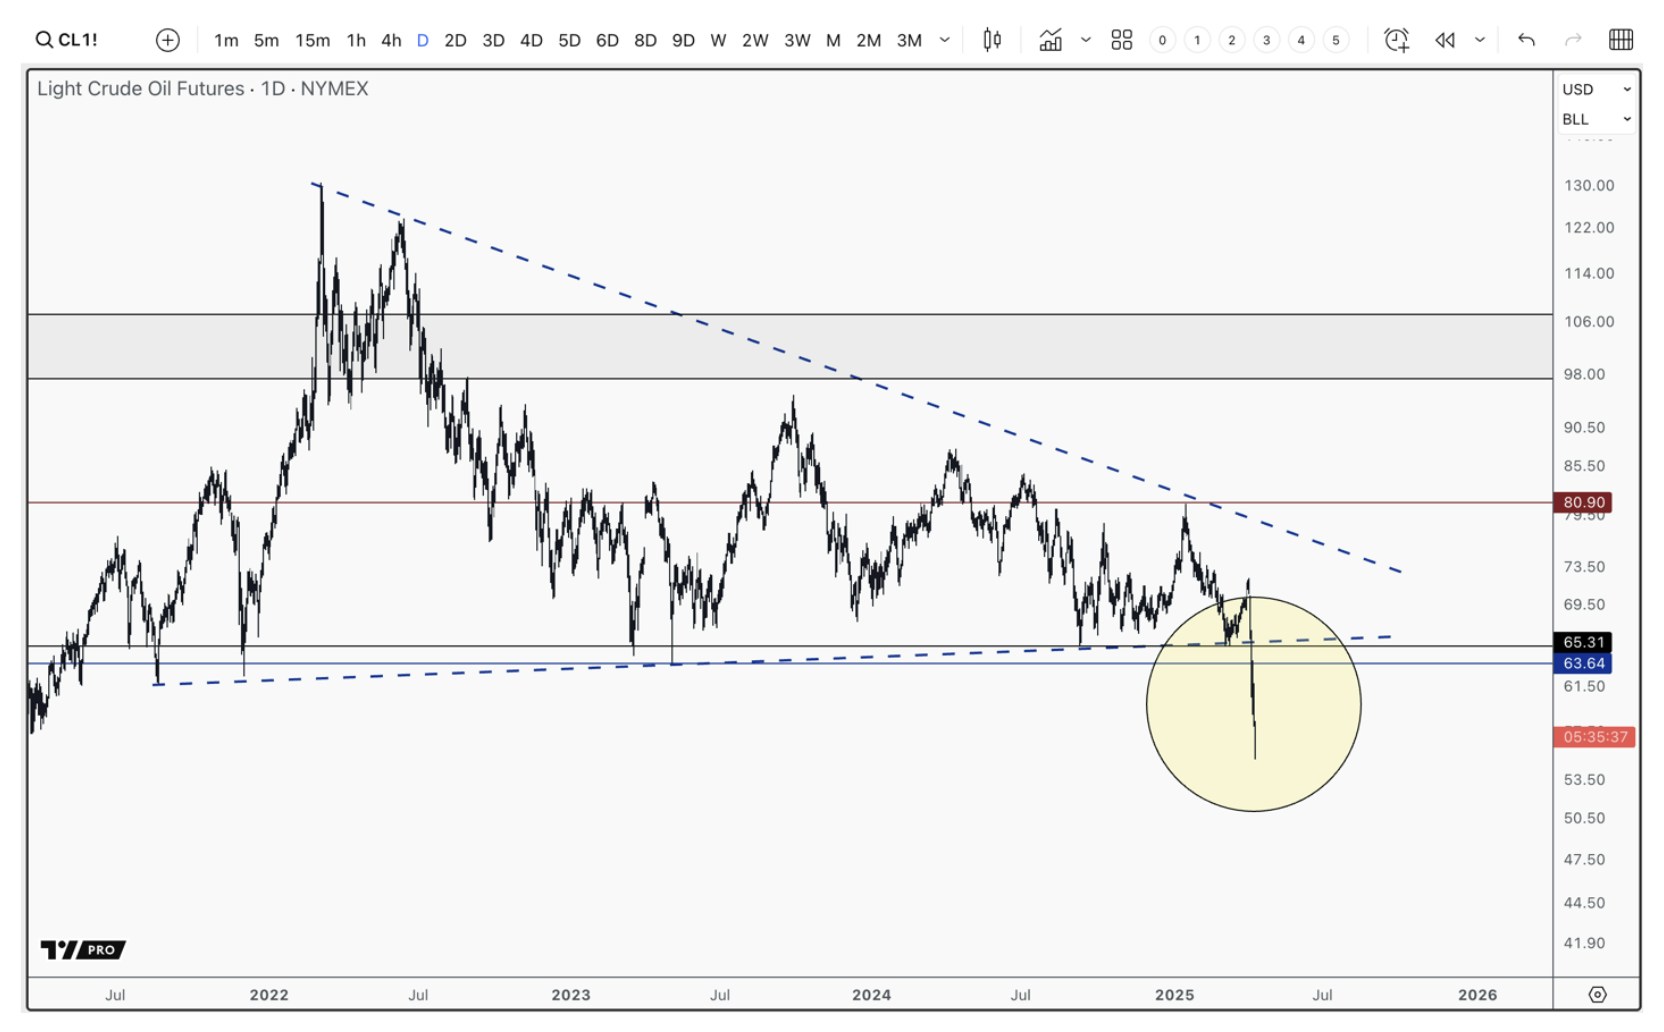
Oil is breaking down from a 3 year consolidation, signaling the rising risk of a global recession.
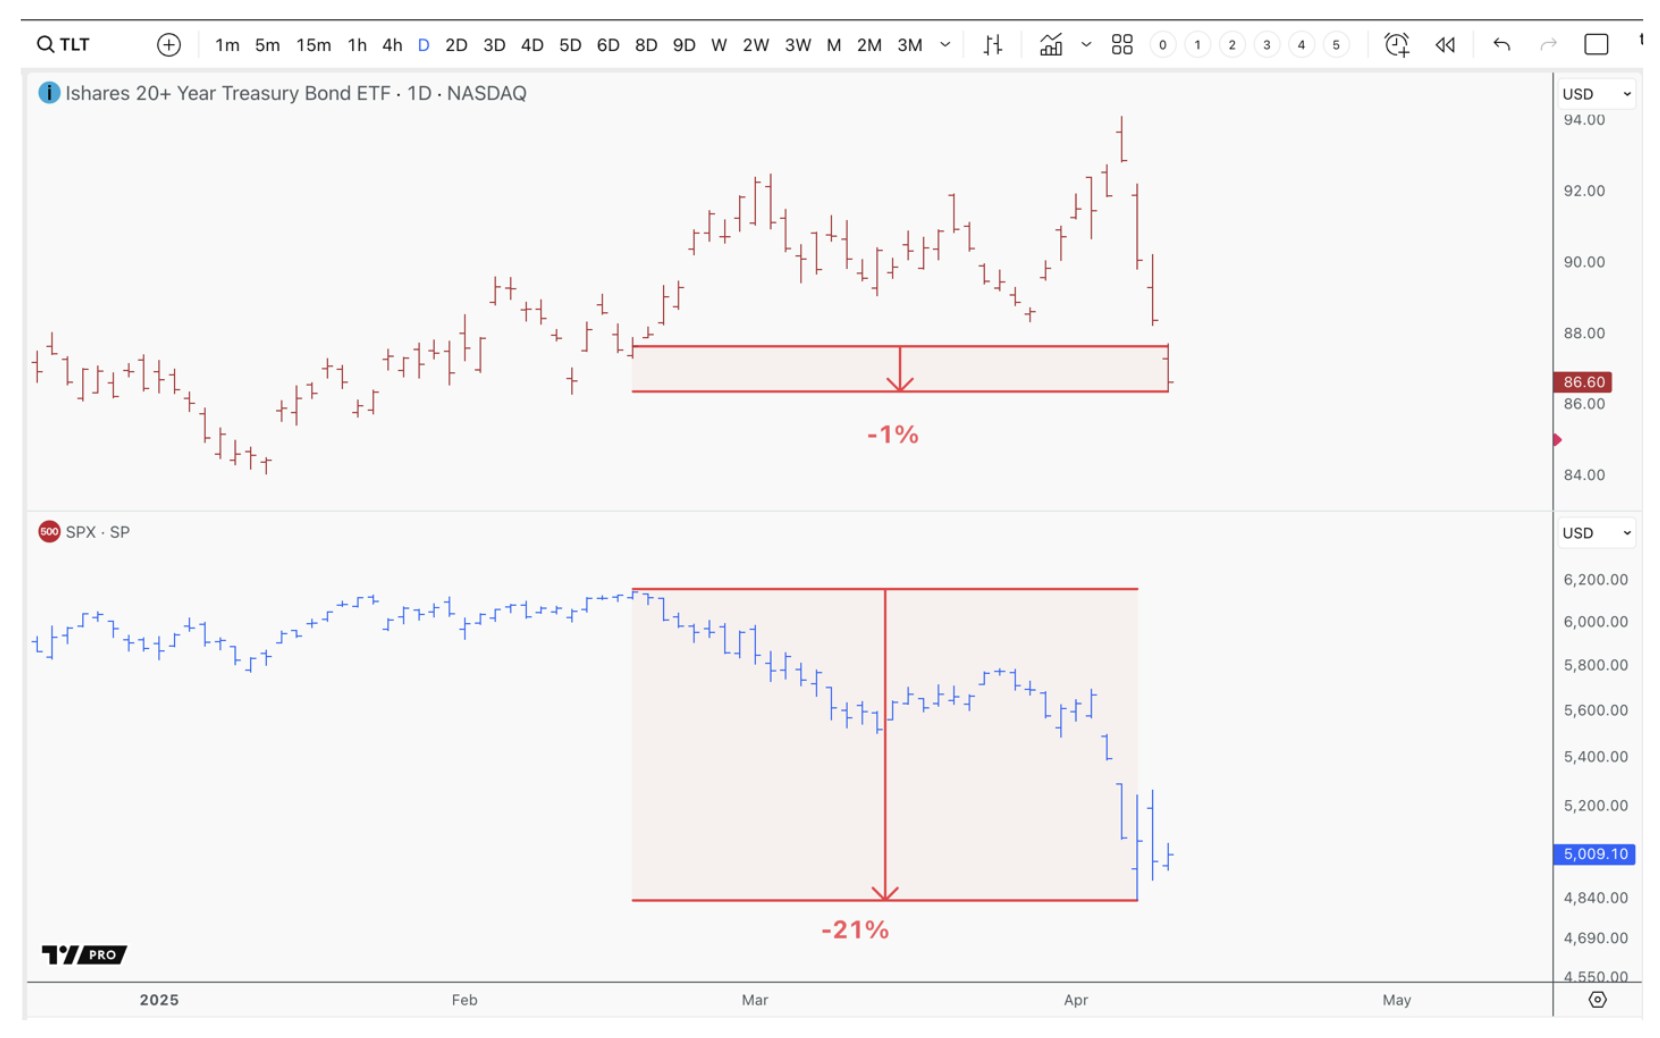
By all accounts, we are in a slowing growth environment, with stocks and oil moving vertically lower into a bear market. If there is any environment in which you’d expect bonds to catch a bid, this would be it. However, since the February high in stocks, TLT is -1%, meaning that the historically safe have of Treasury Bonds are not in demand. This may change, but based on history, we tend to see Treasury Bonds up a meaningful amount this late into a growth slowdown cycle.
For those paying attention, something is different in this cycle. A 25-year correlation between stocks and bonds appears to be breaking. While many are getting caught up in trying to explain why this is happening, the why is simply not important right now. What is important is understanding what the ramifications of this broken correlation will mean in 2025, and if this persists, we could see a more immediate problem in equities than the trade war.

The 25-year correlation between stocks and bonds is not holding up in 2025. Considering the rising recession risk, and a technical bear market is stocks, the safe, fixed yield offered by treasuries is not in demand.
The Government and FED Needs Lower Bond Prices
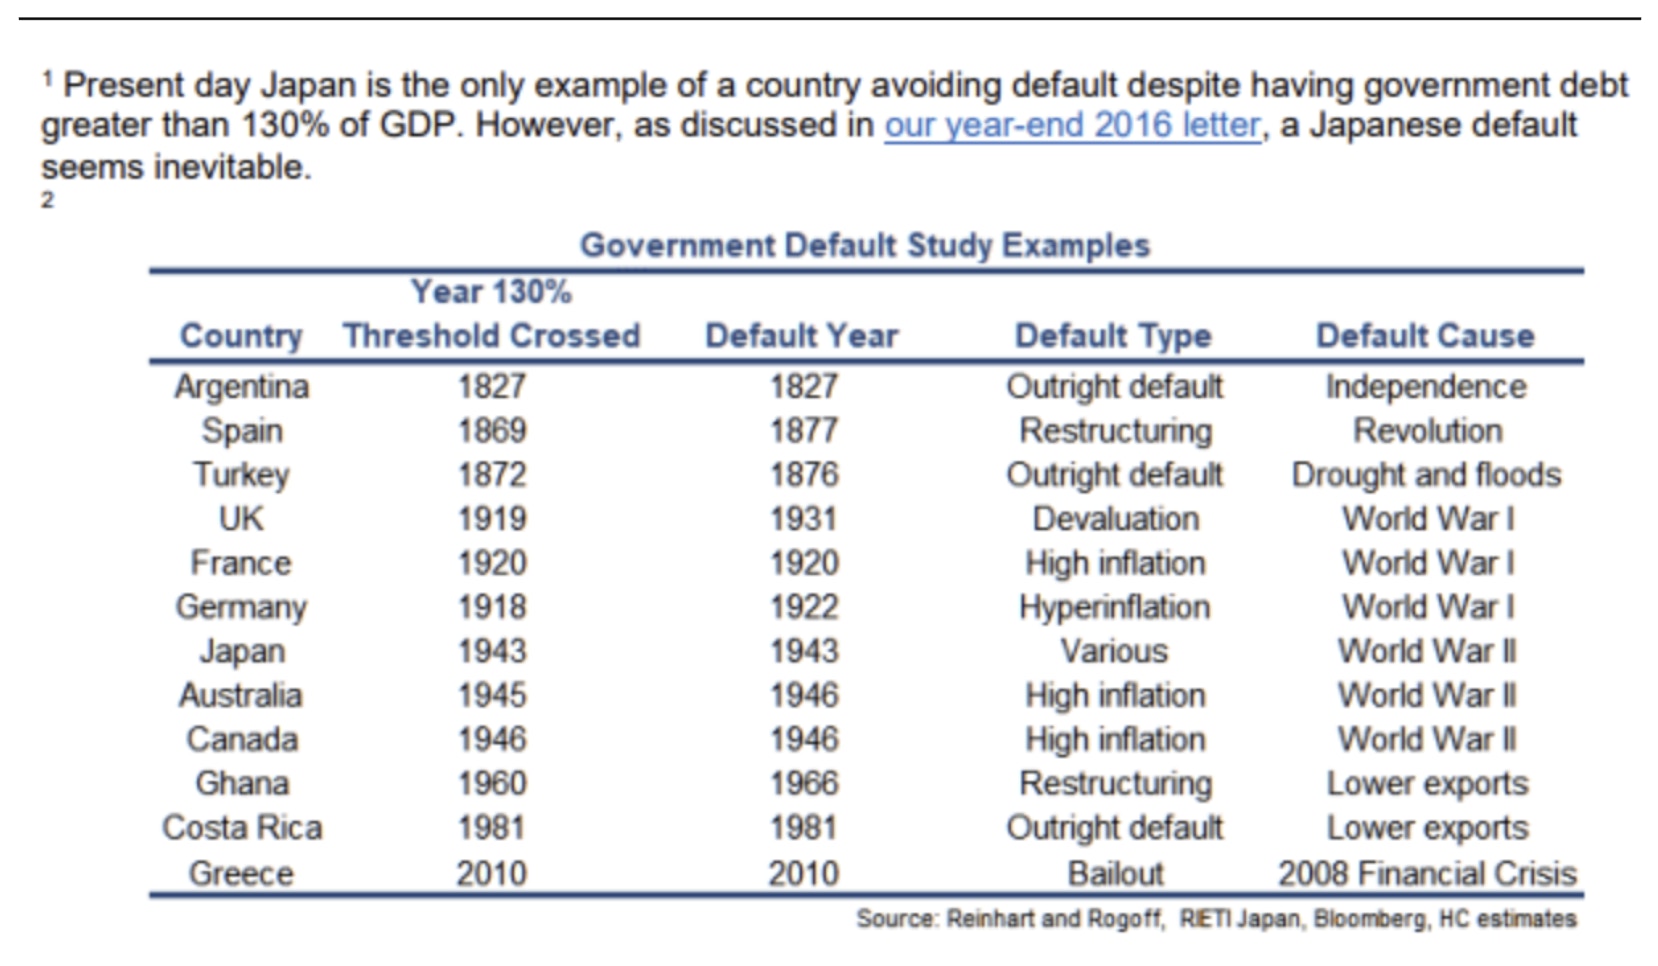
As of December 2024, The United States debt is currently 124% of it’s GDP. This was before GDP was forecasted to shrink in Q1, while Debt is forecasted to continue to rise, even with the efforts of DOGE. This will certainly bring the U.S. into the dreaded 130% Debt/GDP region. Since 1981, 98% of all countries that have reached the 130% Debt/GDP ratio have defaulted on their bonds.

Bloomberg
The problem the US now faces is a runaway bond market, much like we saw in England in 2022. In other words, as new debt is issued with higher yields to pay, more debt will have to be issued to service this debt – i.e., pay the yields. As more debt is used to service the existing and new debt, this puts more money into the economy, which is ultimately inflationary.
As we already know, bonds don’t like inflation, so they go lower, pushing yields higher. This causes a spiral effect. The bond market demands a higher risk premium (higher yield) to hold bonds to maturity, which causes the government to issue more bonds to service this rising risk premium.
I believe the market is signaling to the investors that this process has begun. To put this into perspective, the budget deficit for the fiscal year 2024 came in around $1.9 Trillion, or 6.7% of GDP. There is no other year in US history where the budget deficient was this large outside of a major war, like WW I & WW II, or dealing with a major recession, like 2008. It is unheard of to have fiscal spending this high, in an expanding economy, with historically low unemployment.
From this excessive level, what will deficit spending be if we enter a recession? The biggest misstep the FED and government can make at this juncture would be pivoting while bonds are going down. Until we see Treasury bonds (TLT) breakout and move higher, the FED and government run the risk of losing control of the bond market in a disorderly manner, which would also further tank equities.
This is what’s concerning right now. While we have been trained to hang on until the FED can swoop in and save us, we are being held hostage by the bond market, which is only reacting to decades of reckless spending finally coming to a head.
If a 20% drop in equities, vertical drop in oil prices and growing certainty of a global recession is not enough to get bonds off the floor, what will it take? The bureaucrats that created this mess run the risk of losing control of the bond market if they act too soon. They have no choice but to sacrifice the stock market until bonds catch a meaningful bid.
You might be wondering, why does this matter? Why can’t the FED and Government allow Treasury Bonds (TLT) to go lower? Simply put, the U.S. has to refinance $9.2 Trillion in US debt in 2025 with an estimated $28 Trillion in debt needing to be refinanced over the next 4 years. The cost to refinance this debt will depend on the yield the market is demanding to hold a US government bond until maturity. The lower ETFs like TLT go, the more of a problem the US will have to refinance this debt, further exacerbating the runaway bond market scenario.
For reference, as of February 2025, it currently costs $478 Billion annually to maintain the US debt. This is roughly 16% of the total Federal Spending. Also, for the first time in history, it now costs us more to service the debt than we spend on defense annually.
[mid-signup-palaceholder]
The FED does not control the bond market, though they would like you to think they do. The closer you get to the front end of the yield curve - i.e., 1-month yields of T-Bills to 2-year yields on T-Bills, the more of an influence the FED has on these bonds. However, when you start getting into the 10-year yields and farther out on the yield curve, the more of an influence growth and inflation outcomes have on yields. The bond market is saying, we don’t believe you’ll pay this back, and the consequence of this spending will only lead to inflation. Therefore, we want a higher risk premium (yield) to hold these bonds until maturity. The only problem with this is that the U.S. can’t afford higher yields and must refinance 24.5% of its national debt this year alone.
Sentiment
Currently, the stock market is reacting to the uncertainty in the global economy. What could cause this uncertainty to move lower is how bonds are not moving higher. This could lead to further selling; however, sentiment readings are suggesting that a sizable bounce should happen before we are going to move meaningfully lower.
Investing is a zero-sum game. In other words, for you to win, others must lose. For this reason, measuring what the masses are doing can be quite beneficial as a contrarian indicator. For example, in our February report, we discussed in detail how both fund managers and retail investors were all in on stocks. Almost every measurement used to gauge positioning was at or close to new historic extremes. We tend to see these extremes at meaningful turning points, which is exactly what happened.
Now, with all major US markets confirming a bear market in just under 2 months, we are seeing extreme sentiment readings on the bearish side of the equation. For example, the AAII Investor Sentiment Survey asks retail investors where they think the market will be in the coming months. It has been around since the 1970s and has a remarkable history of signaling turning points in the market through sentiment extremes.
Last week marked the 6th consecutive week in a row where the bearish sentiment was in 97th percentile or higher of all weekly surveys going back to the 1970s. There was no period on record that matched this level of extreme consecutive bearishness – not the COVID lows, the 2009 lows or the 1990 lows.

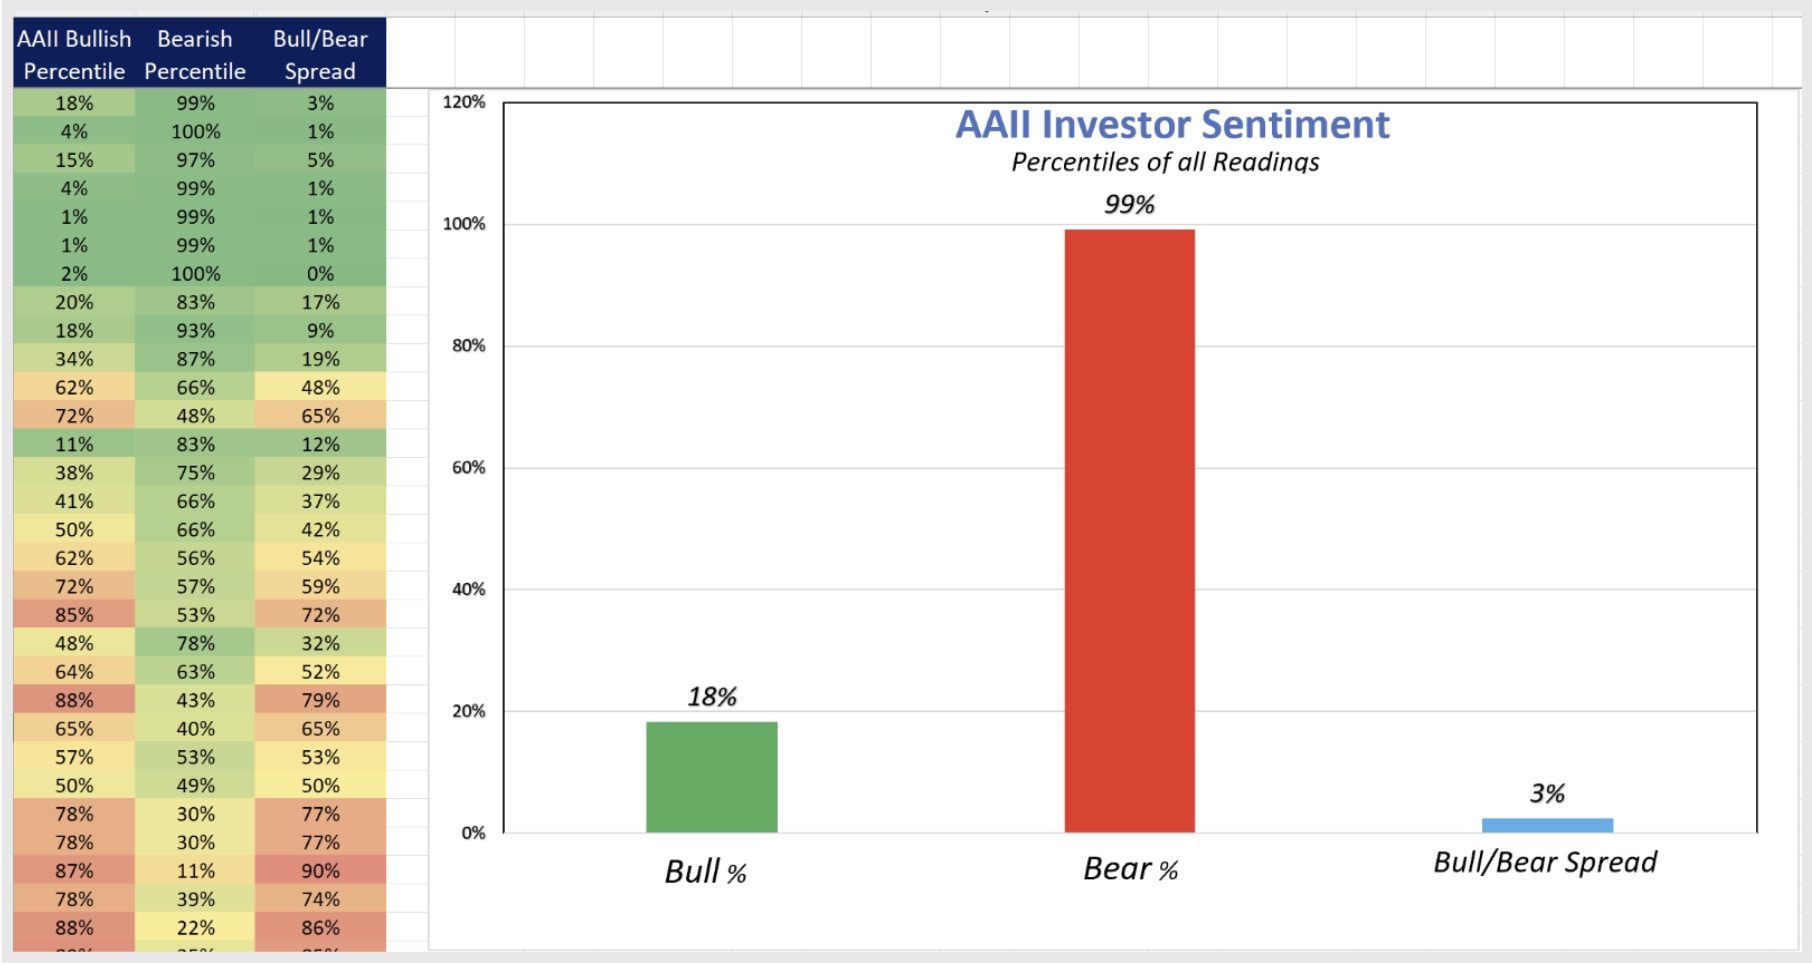
The AAII investor sentiment survey is showing the most bearish 6 week reading in its history. This is the 1st time since the 1970s that we have seen bearish reading in the 97th percentile or higher for 6 consecutive weeks. This data is typically used as a contrarian indicator.
With investors feeling this bad about the markets, history suggests that we should see a sizable bounce, at minimum, soon. Just like everyone piling into stocks at the top, we tend to see capitulation to match extreme bearish sentiment. With the Volatility Index (VIX) hitting 52, which is higher than any point in 2022, as well as the S&P 500 losing 15% in three days, it appears that we are getting capitulation or are close to capitulation.

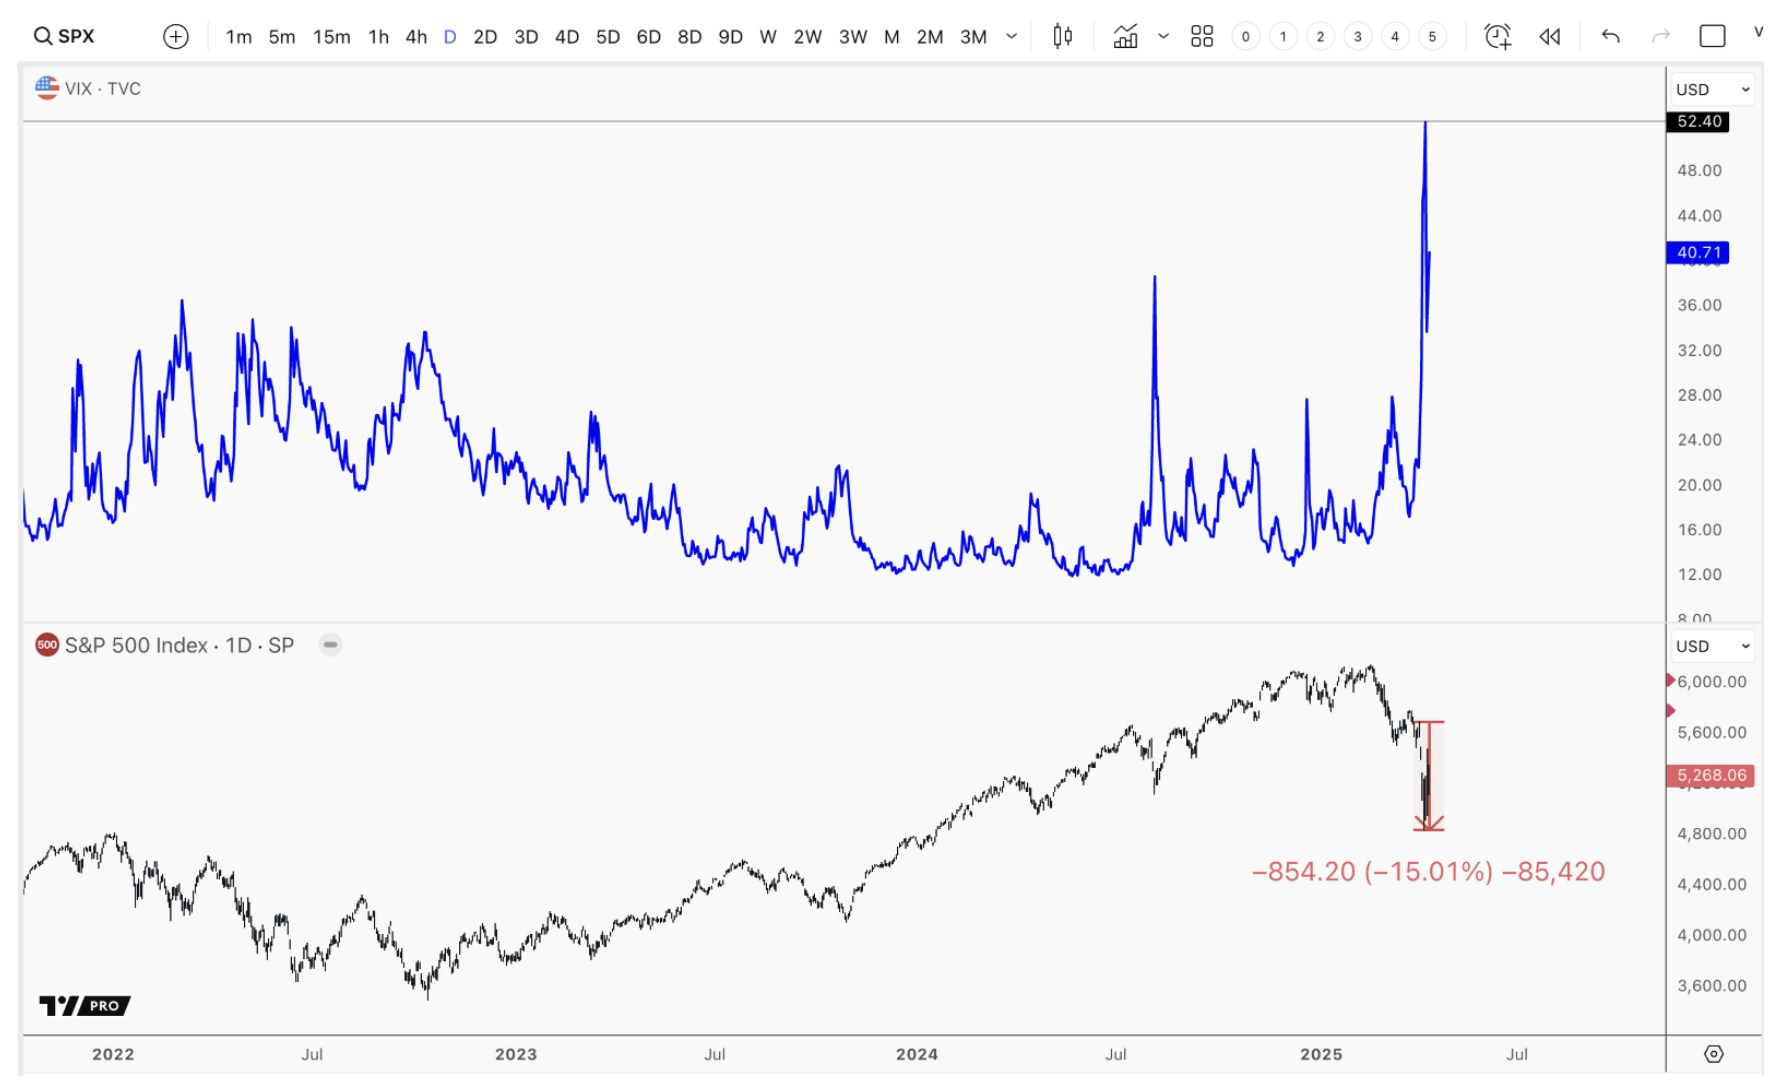
The VIX is has spiked of the highest readings since the COVID crash, coupled with a 15% drop in equities in only 3 days. Could this be capitulation?
What investors need to see is the VIX settle back below 30, and the recent lows made this week hold for confirmation. If both conditions are not met, we expect another leg lower in this portion of the bear market before a bounce.
Broad Market Analysis
Anyone who has been following along based on our analysis should not be losing sleep over the current bout of volatility. Based on the constant warnings we provided throughout 2024, we were in more than 50% cash in January of 2024, and even moved into a 100% hedge position in February of this year.
While we see the potential for another leg lower in this bear market, we should see a sizable bounce first.
We have consistently stated that the first major shot across the bow for the markets is if the S&P 500 breaks the 5400 region. We found support around the 4835 region. If this level breaks, the next level lower is in the 4600 region. With this information accounted for, below are the two scenarios I see as most likely given the current price action.
Red – We are completing the 1st leg down in a much larger bear market. The next move will be a corrective rally that makes a lower high. The targets for this bounce are between 5600 – 6050. This will be followed by the final move lower in the bear market toward 4200 - 3500 SPX.
Green – This drop holds over 4260, which will complete a 4th wave decline in a very large ending diagonal pattern that started at the 2022 lows. The next move higher will take us to the 6300+ region, which will be the final 5th wave in the bull market that started in 2022.

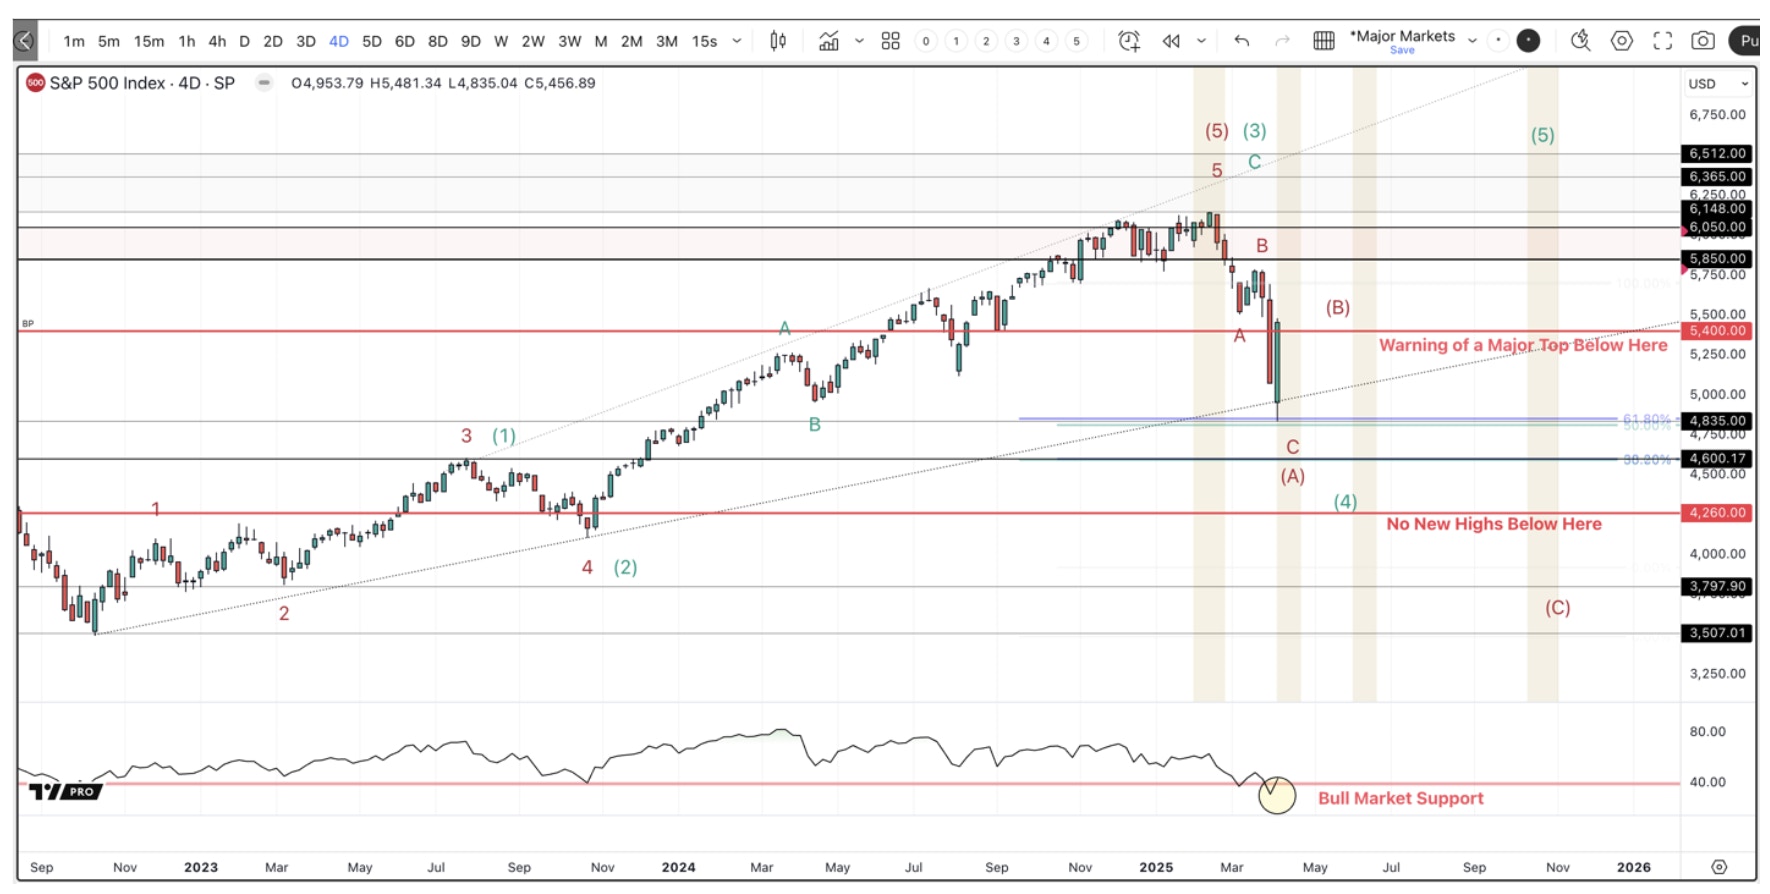
Two Scenario that this bear market in the S&P 500 can play out. Either we put in a big low, and can see all-time highs by fall of 2025, or we will see a lower high/bounce into June that will lead to another leg lower in this bear market.
Further supporting the red scenario, the S&P 500’s Relative Strength Index (RSI) has broken below standard bull market support.
The RSI tends to find support around the 40 region in bull markets and breaks above the 60 – 70 region. In bear markets, the RSI will break below bull market support and fail under the 60 region in bear market rallies. The fact that we broke the defined bull market support for the S&P 500 is concerning.
The first market to break its RSI bull market support was the Russell 2000 (small caps) in mid-February.

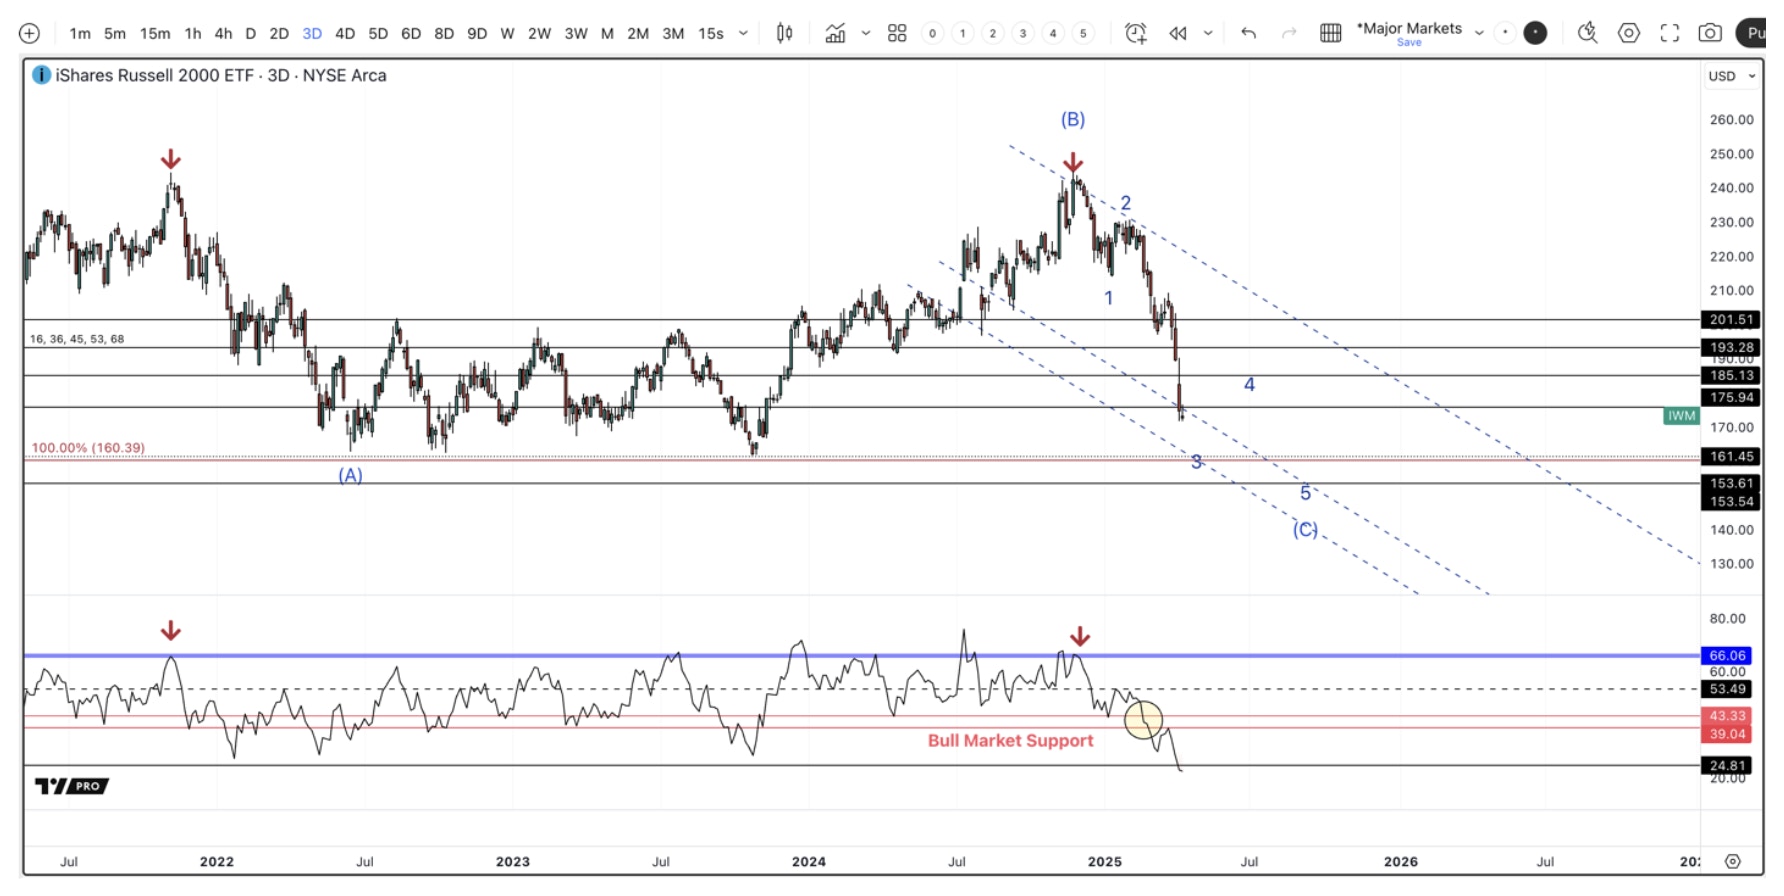
The Russell 2000 small cap index was the 1st index to warn of the coming bear market in 2025.
This was followed by the NASDAQ-100, which broke its bull market trendline along with its RSI bull market support in early March.

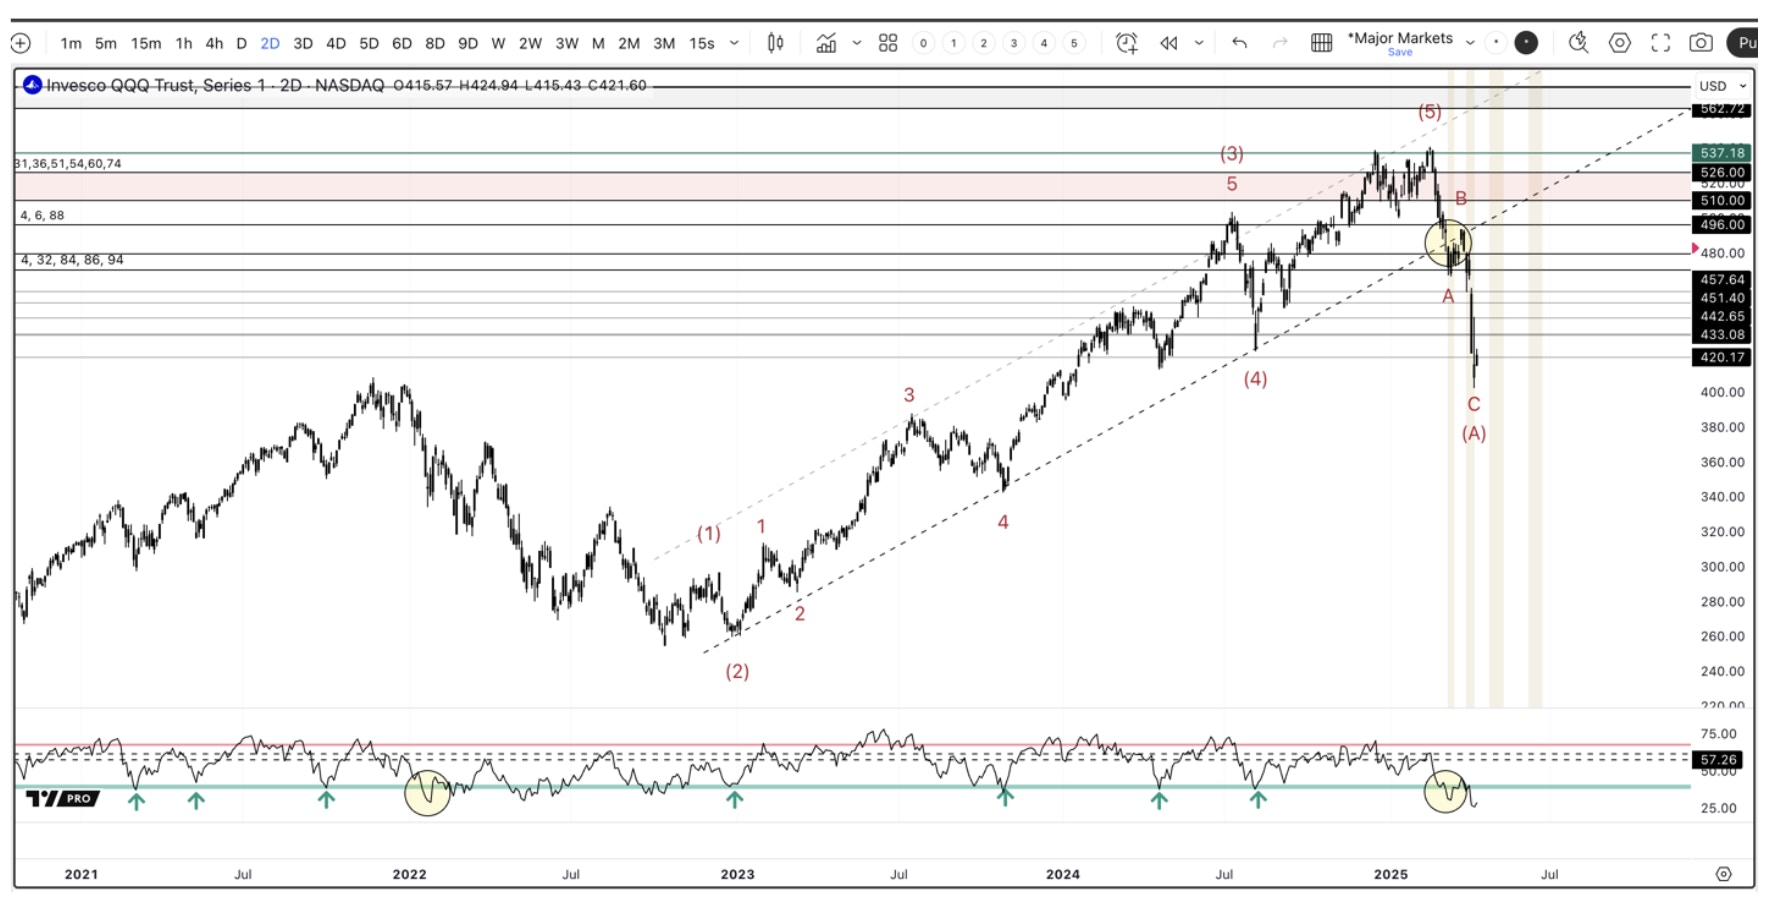
The NASDAQ-100 Big Tech Index was the 2nd, and most important, market to warn of the coming bear market in 2025.
The S&P 500 just broke its RSI bull market support last week, as it found support around the 4835 region, which typically signals a meaningful shift in momentum. If the next large bounce fails under the 60 – 70 region, it could be an early warning that the red scenario is underway.
Conclusion:
In conclusion, we have been warning investors, even in the bull market of 2024 that the uptrend is unhealthy. The many divergences and long-term Elliott Wave patterns were not as healthy as the trend suggested. We further warned our readers to expect more volatility in the February report – at the time, a lone voice in the sea of exuberance. The market has now retraced the entirety of 2024’s gains in less than 2 months.
While we have been buying beaten down AI stocks around these lows, we may not hold them too long into 2025 if the coming bounce starts to fail, further signaling the red scenario is in play.
Investors have been trained to buy-the-dip. Every bear market since 2009 has recovered in short order. Even the COVID decline saw one of the quickest bear markets, and quickest recoveries in history. The difference between these periods and what is happening today is twofold: 1) we never saw a real recession, where growth slows for several quarters and stays at depressed levels; 2) The FED was allowed to put a floor under the stock market with excessive liquidity because inflation and bonds allowed this to happen.
Investors need to be prepared for a changing dynamic, which is being signaled by the bond market. As always, we are buying stocks at depressed prices in hopes of the best-case scenario, but we continue to prepare for the potential of a worst-case scenario.
Regardless, AI will continue to innovate, as we are in the 1st inning of this multi-decade tech trend, and stocks will eventually find a floor, setting up generational buying opportunities for those prepared.
If you went into this sell-off fully invested without any risk management plan, or if you are sitting on outsized losses and not sure what to do, we encourage you to attend our upcoming weekly webinar for premium members. Next Thursday, April 17th, at 4:30 ET. In this upcoming webinar, we will discuss our game plan regarding the remainder of 2025. We will list buy targets for great AI names as well as go over how we plan to raise cash and further hedge our portfolio if this bear market continues into 2026.
The I/O Fund is a leading tech portfolio with annualized return of 27.6% -- which would rank us as #2 in the United States if we were a hedge fund. Learn more here.
Please note: The I/O Fund conducts research and draws conclusions for the Fund’s positions. We then share that information with our readers. This is not a guarantee of a stock’s performance. Please consult your personal financial advisor before buying any stock in the companies mentioned in this analysis.
Recommended Reading:


More To Explore
Newsletter

Nvidia, CXL, and the Battle to Improve AI Inference Economics
This is Part 2 of our two-part series on AI inference economics. In Part 1 — Why Nvidia's Next AI Battle Is About Tokens per Watt, we laid out why tokens per watt has become the defining metric for in

Why Nvidia’s Next AI Battle Is About Tokens per Watt
As hyperscalers move from building AI infrastructure to monetizing it, tokens per watt helps to reflect if revenue is scaling and if profitability is improving. Offload engines can increase tokens per

Micron Is Up 900%. Here’s Why the AI Memory Trade May Still Have Room to Run
Over the past 10 months, memory chip stocks have gone from being solid beneficiaries of the AI boom to capturing a massively outsized piece of the return pie. The inflection in Micron’s performance de
Why the S&P 500 Shrugged Off the Iran War — and What Could Finally Break the Rally
On February 28th, the U.S. went to war with Iran, and the market was handed the kind of shock it hasn't contended with for years. The conflict set off a chain reaction across the region: an ongoing su
Nvidia, CoreWeave, and Nebius: Inside the Circular Financing of the GPU Boom
Neoclouds are one of the more hotly debated AI business models, with CoreWeave and Nebius being the two most widely recognized names. These companies have seen their sales, backlog, and share prices s
AMD, Nvidia, Arm, Intel: Inside the $120 Billion CPU Gold Rush
CPUs have gone from an afterthought to becoming the AI trade’s next great bottleneck – and with AMD, Nvidia, Arm and Intel circling a market that is doubling nearly overnight, the only question left i

Google TPU v8 vs Nvidia: How Inference Is Rewriting the AI Market
In April, Google announced it would begin selling its TPUs to select third-party data center operators, which is something the market has anticipated for nearly a decade. The TPU-versus-Nvidia-GPU deb

The AI Networking Stock That Beat Nvidia by 7X YTD for Returns of 135% YTD
AI networking stock Lumentum is among the key I/O Fund winners in 2026. We allocated heavily to LITE in January—a month before Nvidia backed the company. While most investors couldn’t stomach taking a

Bloom Energy — Our 2026 Top Pick Was the Best Performing Stock in April
April was the best month in six years for the Nasdaq-100. The single best-performing large-cap stock wasn't Nvidia, Microsoft, or Meta. It was Bloom Energy, up roughly 109% in one month. As you'll rec

Inside Nvidia’s $4B Optical Strategy—and Why CPO Changes Everything
Within the AI investment theme, there is nowhere that the supply chain shifts faster than in networking, leading companies to gain content on new platforms or lose incremental share. The reason is str
