AI Stocks Signal a Correction Before a Buying Opportunity Emerges
February 28, 2025

Knox Ridley
Portfolio Manager

In our last broad market report in mid-October of 2024, we stated that “If the S&P 500 can breakout above 5825, then it can likely push into the 6000 – 6185 region.” This was assuming that we hold support at 5675, which we did. Since then, the market topped at 6147 and is currently trading below where we were in October.
We expressed caution in our October report based on several markets and stocks not participating in the uptrend. We also expressed concerns with the reaction in the bond market regarding the FED’s pivot attempt to aggressively cut rates. These warnings remain today and have only become more concerning.
AI Stocks and Intermarket Analysis: Predicting Market Trends Beyond Economics
In an interview with Barrons in 1988, Stanley Druckenmiller stated, “the only good economist I have found is the stock market. People say it has predicted seven out of the last four recessions. That’s still better than any economist I know.” He further backed this claim up by stating that “One of my strengths over the years was having deep respect for the markets and using the markets to predict the economy and particularly using internal groups within the market to make predictions.”
This same sentiment was also expressed by famed fund manager, Peter Lynch, when he claimed that no one was able to predict the 1982 recession, which, at the time, was the worst recession since the great depression. He then stated, “…if you spend 13 minutes a year on economics, you've wasted 10 minutes.”
Both investors are considered market wizards, and both investors analyzed the markets, not the economy, when trying to get ahead of broad market moves. This type of analysis is known as intermarket analysis and, unlike economics, looks at what is going on right now instead of looking back at what already happened or trying to predict too far into the future what will happen.
This type of analysis is what we used on our October 20th 2022 report, to position for the end of the bear market. In this report, we stated…
“We are seeing multiple key sectors within the U.S. not follow the S&P 500 down to a new low last week. Transportation stocks, High Beta and Small Caps have been leading the markets since 2021, and last week, when the S&P 500 made a new low, these risk-on markets made a new high. These types of patterns tend to signal a trend change is brewing.”
We are now seeing the same patterns; however, instead of marking a bottom, they appear to be marking some sort of top.
When all markets, especially the ones sensitive to the economy are trending higher together, you are in a powerful uptrend that should last for a while. On the other hand, when these same sensitive sectors are not moving higher with the broad market, it tends to signal a warning.
AI Stocks and Semiconductors: Key Signals for Market Trends and Volatility
Semiconductor stocks have a long and reliable history of leading market volatility. Historically, this sector tends to be more economically sensitive, showing strong uptrends during economic expansions, as they make the key building blocks of enterprise and consumer technology. They tend to be more economically sensitive and can provide a long lead time between warning investors, and the broad market finally getting the message. Since the 2007 top, semis have provided advanced warnings of notable market turns, including the 2009 bottom, 2015 top, 2018 top, and 2022 top.
In this cycle, we are a handful of semiconductor stocks are the primary recipients of the AI Capex cycle, which has reach nearly $250 Billion from 2023 – 2024, and expected to be $331.5 Billion by the end of this year. This is being fueled predominantly by the capex budgets of four companies – AMZN, MSFT, GOOGL, META.
Considering the importance of AI within this bull market, this sector holds an outsized level of importance. SMH peaked in July of 2024, which we pointed out in prior reports. Interestingly, it is still -14% below it 2024 top, marking one of the longest divergences on record. Like with the above markets, for a meaningful uptrend to resume, we need to see a push to all-time highs. Until this happens, like other periods of volatility, semis could be warning us of market weakness ahead.


Periods when the S&P 500 made a higher high without the semiconductor sector historically signals market weakness that leads to volatility.
The Mag 7’s AI Stocks Diverging
The Mag 7 have been leading this market higher since 2023. Fueled by large Capex spend from Microsoft, Google, Meta and Amazon; their goal, which has been stated on numerous earnings calls, is to be first to market with AI infrastructure and large language models. These companies have repeatedly stated that the risk of underinvesting in AI outweighs the risks of overinvesting in AI.
The roughly $300 billion in capex this year is pointed at a handful of stocks that design AI accelerators, and also those that supply necessary components for large AI systems to scale out and scale up. Nvidia is clearly the primary beneficiary.
The seven stocks that have benefited from the AI trend are NVDA, MSFT, AAPL, AMZN, GOOGL, META, TSLA, and are the undoubted leaders of the current bull market, retuning an average of 128% vs. the S&P 500’s 62% since the October 2022 low.
However, these market leaders are giving off a rare divergence that we have only seen three other times since 2018. While the S&P 500 made a new high on February 19th, the MAG 7 did not. In fact, the collective Mag 7 topped on December 17th, and have since made a series of lower highs. Every time we have since these stocks collectively diverge from the broad market, since 2018, it has led to a greater than 10% drop in equities.


The S&P 500 made a higher high without the Mag 7 Index. This is a rare signal that historically signals market weakness that leads to volatility.
For the AI driven bull market to continue, it follows that the companies responsible for funding the build out of expensive AI infrastructure should also look strong. This is simply not the case, as many of them are already confirming breakdowns that are underway.
Microsoft (MSFT)
Microsoft is one of the Mag 7 stocks that has spent the most in this AI Capex cycle, spending more than $116 billion in 2023 and 2024 combined. For 2025, Microsoft is estimated to spend at least $90 billion, though this may be higher considering it has outlined plans to spend at least $80 billion towards AI data center capacity in fiscal 2025 ending in June.
Interestingly, it has also not made a new high since July of 2024. We have since seen what looks like a large distribution between the $448 - $419 region. Note the two breakdowns circled in yellow. The first was a break i the uptrend, while the 2nd is a breakdown below the $405 support. Unless MSFT can reclaim the $419 - $448 region, the pressure will remain down. Microsoft is likely one of the Mag 7 leading this decline, and it is targeting the $375 - $350 region, if buyers don’t step in soon.


Microsoft stock has been breaking down for weeks, long before the S&P 500.
Google (GOOGL)
Google has contributed approximately $85 billion in capex expenditures over the past two years, with 2025 forecast to see spending rise 43% YoY to $75 billion. Google is one of the more concerning charts of the Mag 7. It topped on February 4th, just before its last earnings report. Since then, it has seen a sharp drop that is flashing warning signs. Google just broke below the uptrend line that has supported the uptrend since the September 2024 low. This is a notable development in technical analysis that suggests more volatility is ahead. GOOGL will need to reclaim this trendline soon to invalidate the signal. If it does reclaim the trend line, it will also need to also reclaim the $196 resistance level to suggest that it could see another push to all-time highs.


GOOGL stock is showing technical weakness, recently breaking a key trend line.
Meta (META)
Meta is projected to spend around $62.5 Billion in capex by the end of 2025, nearly equal to the $66.8 billion it spent in 2023 and 2024 combined. It has also been the strongest MAG 7 in the recent uptrend and has been a heavy spender on its AI build out and a key player in the current bull market. After making a fresh all-time high two weeks ago, what’s worth pointing out is that it did so with lower momentum and lower volume. This is typical of 5th waves, which lines up with the larger pattern that started on the 2022 low.
Considering that price is not below the last two weeks’ lows, it supports a period of volatility into the $590 - $481 region. META must hold $419, or a much deeper correction will unfold.


Meta stock is currently below the prior 2-week lows, signaling a turning point in the trend.
Amazon (AMZN)
Amazon has spent the most, so far, to build out their AI infrastructure. Spending totaled nearly $136 billion in 2023 and 2024 combined, with $104 billion more expected in 2025.
Like GOOGL, the market did not like what it reported in its earnings, showing a sharp drop. Amazon had a strong reaction off the $203.30 support. If AMZN is going to make a new high, it will need to clear $233.50. Even if we see a push to new highs, it does not look like a breakout worth chasing, as it will be the 5th wave, and final swing, in a very large 3rd wave. The 4th wave should take us sub-$200 and last for several months. If instead we break below $203.30, then we have already topped and will look for a low between $186 - $151.

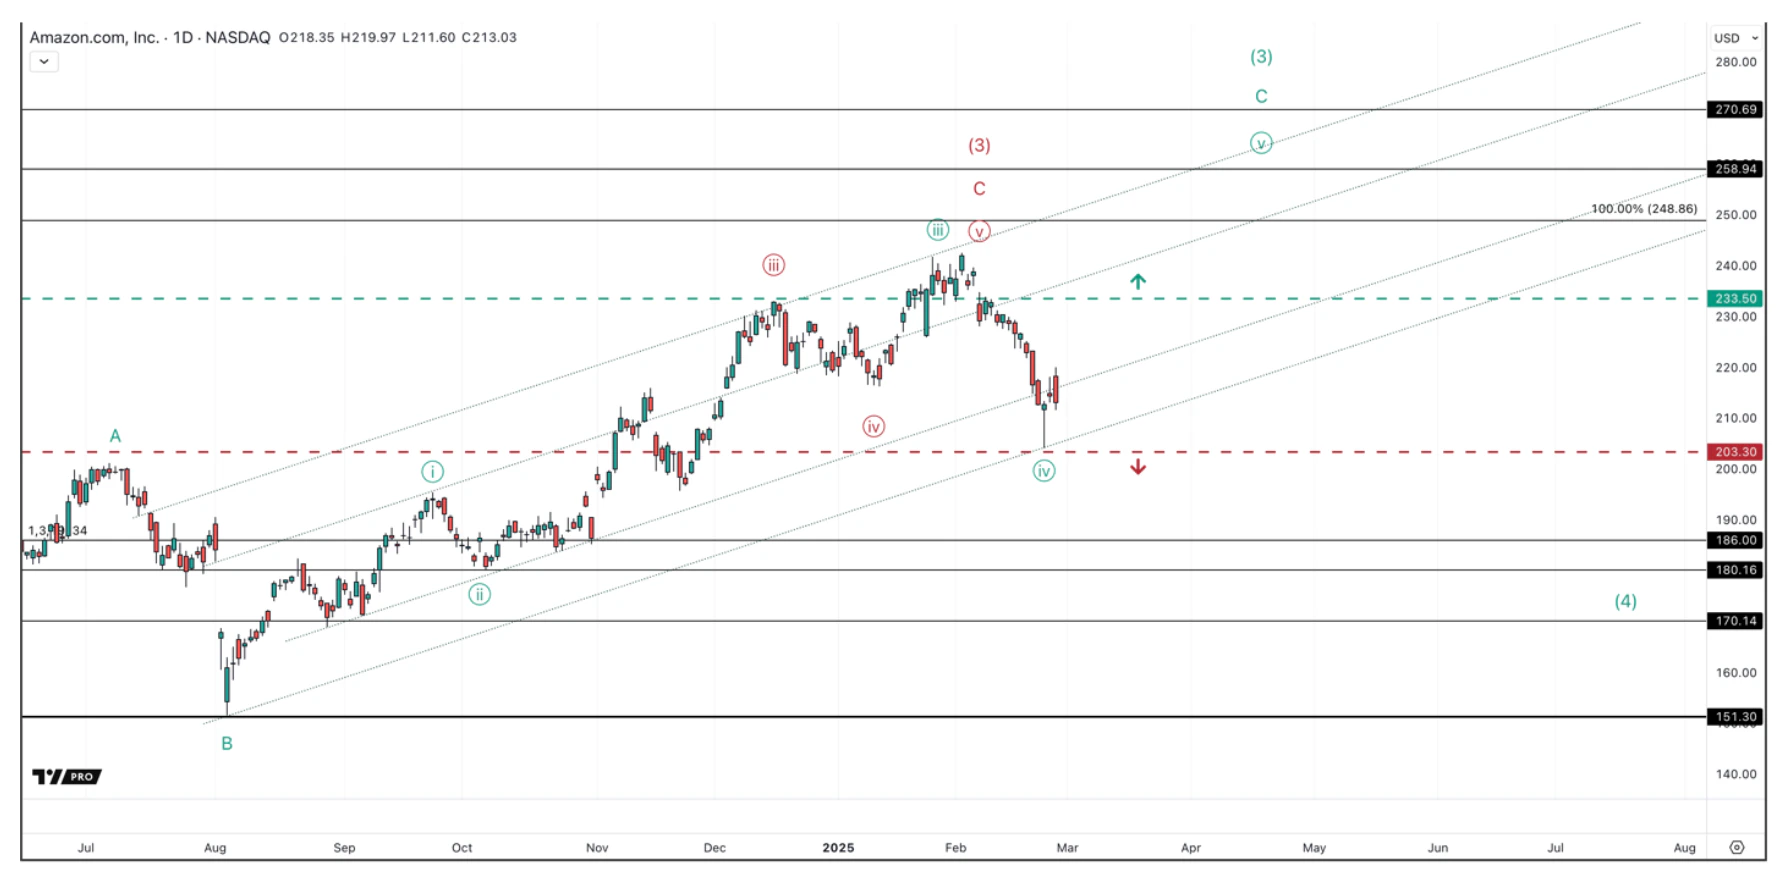
Amazon stocks shows the final support Below the recent low will signal a notable correction is unfolding.
Nvidia (NVDA)
Nvidia has been the primary recipient of the above Big Tech companies’ CapEx spend. For this reason, it has been the darling of the current bull market, and one of the most important stocks regarding the AI focused bull market.
Since the 2022 low, there have been three clear uptrends. We are in the 3rd of these, and it is markedly different than the prior two. For one, unlike the 1st two, the uptrend that started in August of 2024 is relatively weak with a messy and overlapping structure. The prior two were nearly vertical. The second notable difference is that volume is weakening as price goes higher into the current uptrend. This is not like the prior two uptrends that saw volume expand with price.


NVDA has seen 3 uptrends since the 2022 low, the most recent is notably weaker.
If we examine the potential pattern the current uptrend is taking, there are only two that make sense, given the price action.


Nvidia’s stock is range bound, with a probable target of sub-$100
- The Green Count - If this is a continuation of the larger uptrend, it is taking the form of an ending diagonal pattern. These patterns are the final 5th wave in a larger 5 wave uptrend, and they tend to follow a powerful 3rd wave uptrend, which is what we saw with NVDA in 2024.
Ending diagonals are also a 5 wave patterns that have significant overlaps and are relatively weak. If this is the pattern in play, we will need to hold over the $119 - $123 support zone and then break above the $144 - $149 resistance zone. If this does happen, we will be in the 5th wave of this ending diagonal, which will target between $165 - $211. This will end the 5th wave and should lead to a notable retrace. - The Blue Count - Considering the messy and overlapping nature of this uptrend, there is a chance that this was a corrective bounce in an on-going correction that started in June of 2024. This would suggest that the B wave of this downtrend ended on January 7th with a double top. The final C wave drop should break below $123 - $119 and find support between $102 - $83.
Considering that Nvidia has been the market leader since 2023, and the most important name in the AI infrastructure spending cycle, how this stock trades will be very important to the bull market. More importantly, what will be the catalyst to push it to new highs?
We have been saying for a while that the NVL systems should be that catalyst, expecting fireworks by now. There is $100 billion pointed at one SKU, which is unheard of (the NVL72 systems alone are expected to reach 30,000 racks at the midpoint at $3 million per rack). It took the iPhone fifteen years to get to that revenue (2023). Needless to say, this is an important SKU in terms of a catalyst.
Sign up for I/O Fund's free newsletter with gains of up to 2600% because of Nvidia's epic run - Click here


However, underneath the bullish language and standard beat/raise we’ve become accustomed to with NVDA reports, this week’s report confirmed Nvidia “had a hiccup that probably cost us a couple of months.” Nvidia stated the NVL systems have “successfully ramped in production” but did not say they were shipping in volume, which was the original expectation. This is also present with the price action in the NVL suppliers. You simply can’t put $100 billion into production for one SKU and ship in volume without a splash in the large supply chain that builds these AI systems. There was no splash (yet). We covered this more here.
Some might be thinking that what we are seeing is a rotation from the overextended Mag 7 into other, beaten down names in the market. In other words, this would be a positive sign, as the FED has engineered a no-landing scenario, and the bull market is about to continue to grind higher with more involvement.
If this were the case, we would see a rotation from the Mag 7’s December 17th top into beaten down sectors like transportation, small caps, high beta, retail sales, biotech, etc. These are sectors that not reclaimed their 2021 highs and would benefit from a further economic expansion with lower rates and expanding credit.
However, since the December 17th high in the Mag 7, we have seen money flow into predominantly risk-off sectors that represent inflationary and defensive positioning. Gold, Healthcare, Utilities, Energy, Financials, Consumer Staples, even Long-Dated bonds and Money Markets are outperforming most risk-on sectors. This is where money should be flowing, if this narrative were true, all of which are getting sold since money started rotating out of the Mag7.


Since the Mag 7 topped in December, money is flowing into risk-off sectors.
Sentiment
After seeing two back-to-back years of +20% returns in the markets, we are seeing historically high valuations coupled with historically high sentiment. The Bank of America Global Fund Manager Survey for December, which monitors how money managers are positioned, shows the lowest allocation to cash on record.


This is followed up with the highest allocation to equities on record.


Fund managers are all in on stocks, unlike any period we have ever seen.
The same can be said about retail investors. When we look at the most recent data of the equities held as a percentage of financial assets for US households, it has just reached all-time highs, surpassing the 2000 top and 2021 top.


Retail is all in on stocks in 2025
This trend reached a climax into the recent February top. JP Morgan saw the biggest weekly inflow of retail funds into equities starting February. Of this money, over 70% went into the Magnificent 7 stocks.


On aggregate, retail exposure to equities has more than doubled since the start of 2025


It appears that everyone is all-in on this bull market, with a level of exuberance that historically does not last. However, an important point to consider considering that retail is pushing more money into the Mag 7 on record – with this level of fund flows into these names, why are they not pushing to all-time highs? The only explanation is that bigger institutions are selling into the retail buying frenzy.
Broad Market Analysis
We have reached the upper target zone outlined in our last October report. Now that we are here, the potential target zone has been adjusted to account for multiple scenarios that could play out.
Even the most bullish interpretation of the bull market off the 2022, suggests that, at some point within the 6140 - 6500 target zone, we should start a relatively large correction back to the 5600 – 5200 region this year.
However, note the Relative Strength Index (RSI) below. It has made a series of lower highs, suggesting momentum is fading the higher price pushes. This is the type of divergence we see at market turning points, especially when the RSI starts closing below the 60 region, as we just did at the recent February high.


The S&P 500 is setting up for a sizable correction
Since 2024, each dip has found a low on the 53 region on the RSI. This level just broke, which suggests a drop to the bull market support region at 39 of the RSI. The market is currently on its last leg before fully confirming this drop.
The RSI can give advanced warnings of bigger moves, and as of today, it is breaking below the minor dip level that has caught each dip in 2024. Now, we need confirmation with price. If we see a sustained break below 5885 - 5860, I am expecting a drop into our lower SPX target around 5600. If this level does not hold, the level below that is 5200. This scenario is shown in blue and appears to be the most probable outcome.
However, while we are seeing ample signs of a market starting to break down, until SPX gives us a sustained break below 5860, this market has the potential to make one more swing into the 6300 – 6500 before starting this larger correction that we believe is on the horizon. This scenario is shown in green in the chart below.


The S&P 500 is on its last leg before confirming a drop into the 5600 region, minimum.
For this to happen, we need to hold over 5885 - 5860 and break above 6080 to suggest this is likely to play out. What this would mean is that this is a minor correction, which will lead to one more high before the larger correction unfolds. If this happens, based on the warning signs discussed, we will not chase this push higher, and likely sell more into it.
The I/O Fund has been 100% hedged since December 27th. The portion of the correction that we are in could potentially see us hit our targets below in a short amount of time. If this happens, we plan to remove our hedges and add the cash that we raised into beaten down AI names.
Conclusion:
In conclusion, while the market continues to push higher, it has been doing so without the support of key stocks and important sectors. As we’ve seen in times past, while this divergence can go on for a while, unless it invalidates with all sectors and stocks breaking to new highs, it tends to act as a warning. With money managers and retail investors all-in on stocks, it appears that the stage is being set for a potential rug pull this year. While this bout of volatility may have already started, we still could see one more swing into the 6300 first.
We do not believe this is the end of the bull market, especially considering the on-going Capex spend and products coming to market to meet that flow of money. We have set up aggressive buy targets for some of the Mag 7, as well as suppliers that we believe should benefit from the continuation of the AI bull market.
If you are overexposed to equities, sitting on outsized gains, or looking for a safe entry into richly valued tech stocks, we encourage you to join our weekly webinar for Premium Subscribers. Every week at 4:30 EST, we discuss broad market risk, our personal risk management strategies, as well as long-term buy targets for important AI stocks.
Disclosure: The I/O Fund owns Nvidia and a handful of Nvidia suppliers including some of the suppliers listed in this analysis. To view the full portfolio, subscribe here.
Please note: The I/O Fund conducts research and draws conclusions for the company’s portfolio. We then share that information with our readers and offer real-time trade notifications. This is not a guarantee of a stock’s performance and it is not financial advice. Please consult your personal financial advisor before buying any stock in the companies mentioned in this analysis. Beth Kindig and the I/O Fund own shares in NVDA at the time of writing and may own stocks pictured in the charts.
Recommended Reading:


More To Explore
Newsletter

Nvidia and Google Are Crowding TSMC’s N3 Node - Can Intel Fill the Gap?
Nvidia is moving its next-generation Rubin GPUs from 4nm to 3nm, yet Google’s latest TPUs are already on N3 and are expected to remain there. Meanwhile, a growing number of AI CPUs from Nvidia, Amazon

Intel vs TSMC: How CoWoS Packaging Constraints Could Create an Opportunity for Intel Foundry
Taiwan Semiconductor (TSMC) is the single, most important company to the AI industry. However, to compete with the incumbent, Intel does not need to beat TSMC at leading-edge manufacturing. It only ne

Big Tech’s Free Cash Flow is Turning Negative – Who's Next?
Big Tech’s AI revenue is accelerating, but free cash flow is moving sharply in the opposite direction. Across Google, Microsoft, Meta and Amazon, capex is rising much faster than operating cash flow a
Big Tech Earnings Preview: Is AI Monetization Finally Catching Up to Capex?
The most pronounced difference between 2026’s tech rally compared to rallies in the past is which companies have been left out of it. The names most associated with the AI trade have hardly participat
Nvidia, CXL, and the Battle to Improve AI Inference Economics
This is Part 2 of our two-part series on AI inference economics. In Part 1 — Why Nvidia's Next AI Battle Is About Tokens per Watt, we laid out why tokens per watt has become the defining metric for in
Why Nvidia’s Next AI Battle Is About Tokens per Watt
As hyperscalers move from building AI infrastructure to monetizing it, tokens per watt helps to reflect if revenue is scaling and if profitability is improving. Offload engines can increase tokens per

Micron Is Up 900%. Here’s Why the AI Memory Trade May Still Have Room to Run
Over the past 10 months, memory chip stocks have gone from being solid beneficiaries of the AI boom to capturing a massively outsized piece of the return pie. The inflection in Micron’s performance de

Why the S&P 500 Shrugged Off the Iran War — and What Could Finally Break the Rally
On February 28th, the U.S. went to war with Iran, and the market was handed the kind of shock it hasn't contended with for years. The conflict set off a chain reaction across the region: an ongoing su

Nvidia, CoreWeave, and Nebius: Inside the Circular Financing of the GPU Boom
Neoclouds are one of the more hotly debated AI business models, with CoreWeave and Nebius being the two most widely recognized names. These companies have seen their sales, backlog, and share prices s

AMD, Nvidia, Arm, Intel: Inside the $120 Billion CPU Gold Rush
CPUs have gone from an afterthought to becoming the AI trade’s next great bottleneck – and with AMD, Nvidia, Arm and Intel circling a market that is doubling nearly overnight, the only question left i
