NASDAQ REBALANCE: WHAT YOU NEED TO KNOW
August 01, 2023

Beth Kindig
Lead Tech Analyst
This article was originally published on Forbes on Jul 28, 2023,12:07am EDT
On June 30th, the NASDAQ posted the strongest first six months in the index’s history, dating back to 1971. The 6-month returns of 30.5% in 2023 easily beats the prior record of 25.2% in 2019. The majority of the rally was driven by seven stocks: Apple, Microsoft, Nvidia, Amazon, Tesla, Meta, Google. These 7 stocks are up a collective 98% YTD, while the equal weight S&P 500, which provides an equal weighting to all 500 stocks in the index, is up only 9%.

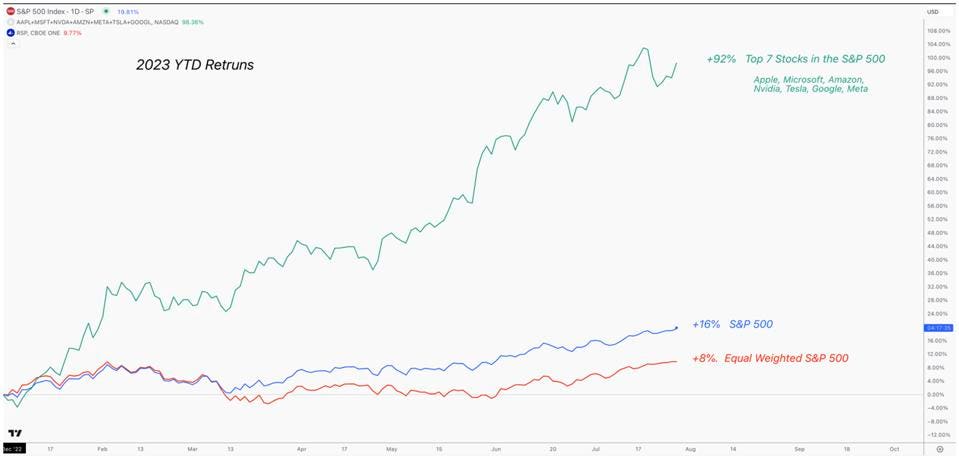
Source: I/O Fund
Sign up for I/O Fund's free newsletter with gains of up to 221% - Click here
This level of narrow leadership continues to pose a problem for active managers who are more diversified than the NASDAQ-100. In fact, by Q1 of 2023, only 1/3 of active managers were ahead of their benchmark in 2023.
As a result, the NASDAQ is being forced by the SEC to rebalance their tech-heavy index, the NASDAQ-100, which will shift the focus away from the top seven stocks in the market, and redistribute weightings to less popular names in the index, like Starbucks and Broadcom, to name a few.
The reason for the rebalance is due to the Magnificent Seven taking up 55% of the Index’s weighting prior to the rebalance. Here was the NASDAQ-100’s weighting prior to the rebalance (as of July 18)
MSFT – 12.7%
AAPL – 12.1%
NVDA – 7.4
GOOGL – 7.3%
AMZN – 6.8%
TSLA – 4.5%
META – 4.4%
On July 14th, the new weighting was announced: NVDA and MSFT would receive the biggest cuts of about 3% each, while AAPL only got shaved by 1% (making it the new top position). Google was cut by 2%, while META and TSLA by 1%. The new rebalance dropped the overall weighting from 55% to ~38%. The NASDAQ-100 topped about 4 days later, and has since been in a minor correction.
Being a static index, a rebalance is a rare occurrence, as it has only happened twice since 1998. The last time was in April of 2011 and was focused on Apple’s outsized weighting in the index. At the time it accounted for just over 20%, and was rebalanced back to 12%. Below shows when this was announced and how it affected the stock. Though the macro environment was much different in 2011, it’s worth noting that Apple had an immediate dip that was quickly bought.
Every Thursday at 4:30 pm Eastern, the I/O Fund team holds a webinar for premium members to discuss how to navigate the broad market, as well as various stock entries and exits. We offer trade alerts plus an automated hedging signal. The I/O Fund team is one of the only audited portfolios available to individual investors. Learn more here.

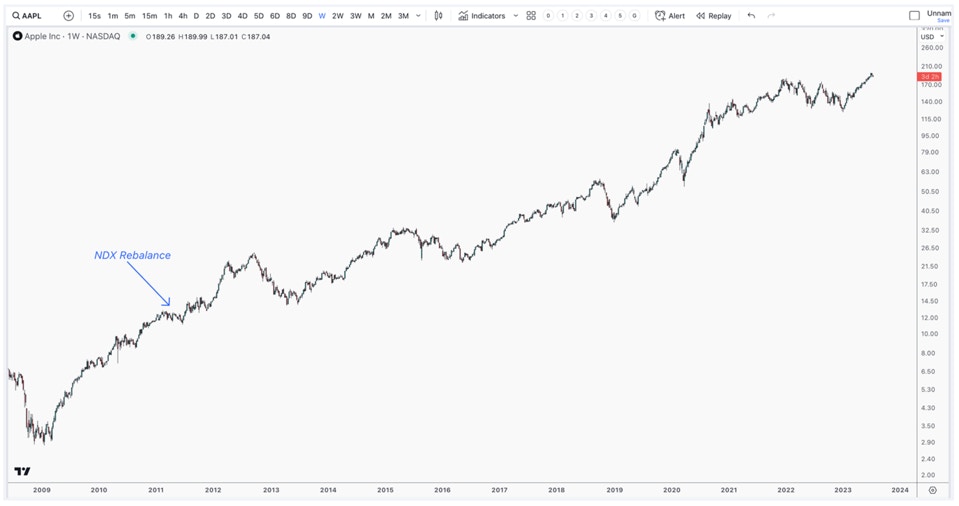
Source: I/O Fund
We believe this is worth monitoring as $209 Billion is currently in QQQ, an ETF that tracks the NASDAQ-100. This means that MSFT, for example, lost $18.8 Billion in demand from this single ETF having to rebalance in accordance with the new changes. Furthermore, many institutional funds are benchmarked to this index, and are in the process of rebalancing their portfolios to coincide with these changes, which should further affect demand.
Our current take on the market is that if SPX break below 4515, then the market has likely topped. Below 4275 and SPX has put in a big top and this would be bearish. On the other hand, if 4275 is defended, then our firm will layer into more stocks as this would be bullish. The level of 4275 is of critical importance and we will update our Premium Members with our buy plan if we get here.

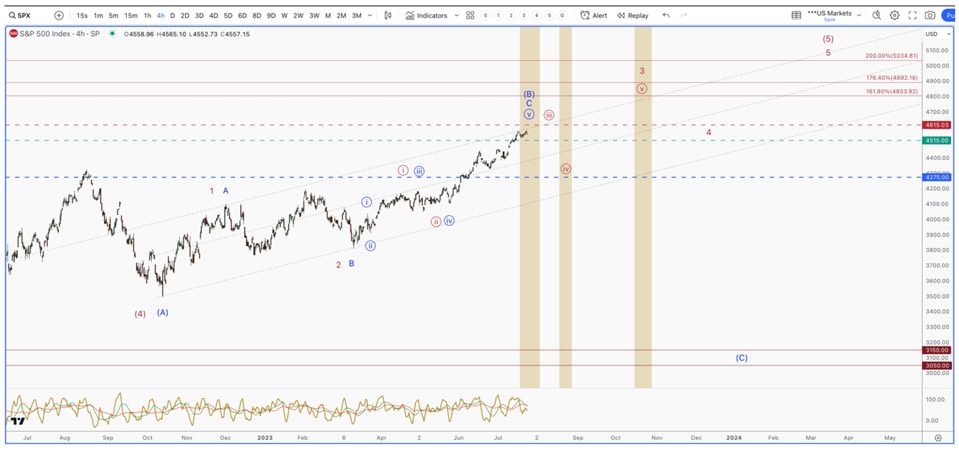
Source: I/O Fund
I/O Fund Portfolio Manager, Knox Ridley, contributed to this article .
Recommended Reading:


More To Explore
Newsletter

Big Tech’s Free Cash Flow is Turning Negative – Who's Next?
Big Tech’s AI revenue is accelerating, but free cash flow is moving sharply in the opposite direction. Across Google, Microsoft, Meta and Amazon, capex is rising much faster than operating cash flow a

Big Tech Earnings Preview: Is AI Monetization Finally Catching Up to Capex?
The most pronounced difference between 2026’s tech rally compared to rallies in the past is which companies have been left out of it. The names most associated with the AI trade have hardly participat

Nvidia, CXL, and the Battle to Improve AI Inference Economics
This is Part 2 of our two-part series on AI inference economics. In Part 1 — Why Nvidia's Next AI Battle Is About Tokens per Watt, we laid out why tokens per watt has become the defining metric for in
Why Nvidia’s Next AI Battle Is About Tokens per Watt
As hyperscalers move from building AI infrastructure to monetizing it, tokens per watt helps to reflect if revenue is scaling and if profitability is improving. Offload engines can increase tokens per
Micron Is Up 900%. Here’s Why the AI Memory Trade May Still Have Room to Run
Over the past 10 months, memory chip stocks have gone from being solid beneficiaries of the AI boom to capturing a massively outsized piece of the return pie. The inflection in Micron’s performance de
Why the S&P 500 Shrugged Off the Iran War — and What Could Finally Break the Rally
On February 28th, the U.S. went to war with Iran, and the market was handed the kind of shock it hasn't contended with for years. The conflict set off a chain reaction across the region: an ongoing su

Nvidia, CoreWeave, and Nebius: Inside the Circular Financing of the GPU Boom
Neoclouds are one of the more hotly debated AI business models, with CoreWeave and Nebius being the two most widely recognized names. These companies have seen their sales, backlog, and share prices s

AMD, Nvidia, Arm, Intel: Inside the $120 Billion CPU Gold Rush
CPUs have gone from an afterthought to becoming the AI trade’s next great bottleneck – and with AMD, Nvidia, Arm and Intel circling a market that is doubling nearly overnight, the only question left i

Google TPU v8 vs Nvidia: How Inference Is Rewriting the AI Market
In April, Google announced it would begin selling its TPUs to select third-party data center operators, which is something the market has anticipated for nearly a decade. The TPU-versus-Nvidia-GPU deb

The AI Networking Stock That Beat Nvidia by 7X YTD for Returns of 135% YTD
AI networking stock Lumentum is among the key I/O Fund winners in 2026. We allocated heavily to LITE in January—a month before Nvidia backed the company. While most investors couldn’t stomach taking a
