Where the Market is Headed Next
June 08, 2023

Knox Ridley
Portfolio Manager

When the market was selling tech last year, the I/O Fund was buying AI leaders. For example, from September 2021 through January of 2023, we initiated 9 buy alerts for NVDA below $210. The last two alerts were at $108 and $149 in late 2022. We initiated buy alerts for additional AI stocks, as well, resulting in a 45% allocation to AI going into May. Compare this to Stanley Druckenmiller, who had 29.5% allocation in AI, and has been covered by the press as the leading AI investor.
Our high allocation to AI is not a surprise to anyone following our firm, as Lead Tech Analyst, Beth Kindig, has covered Nvidia’s AI thesis 27 times over the past 5 years.
Now that the AI frenzy is building, I/O Fund has been raising cash from these positions in 2023, while still holding them as our top holdings. For example, going into NVDA’s historic earnings call, we had raised cash in 2023 from this position, and we were still able to hold it at a 15% allocation, plus we held another leading AI stock at a 12% position.
While the market has rewarded those early to this microtrend, the broad market is currently signaling that volatility is likely to return in the summer/fall time. There are simply too many divergences amongst Tech and economically sensitive sectors to suggest a healthy market is building. Furthermore, inflation is far from under control, meaning the FED is unlikely to provide liquidity any time soon. But, even if the market is looking past this, and we are in the early stages of a new bull run, we are likely setting up for a large pullback into the summer/fall.
We combine broad market analysis with tech analysis to help us better time when to get aggressive and when to be defensive. We believe now is a time to be cautious until we see how the nature of the coming volatility. Whether we are starting a new bull market, or targeting fresh lows, we do not believe now is the time to buy tech even with a long-term time frame in mind.
Broad Market Analysis
Contrarianism is a rewarding investing thesis. The idea is that the market is a zero sum game. For me to win, others must lose, and vice versa. When the crowd stampedes into a trade, this explains why taking the other side of that bet is often correct.
Today, we are seeing one of the largest net short positions in the hedge fund community since 2011. Every time this level of sentiment led to a crowded bet, the market snapped back, punishing the crowd. This information is one of the primary points in the ongoing bull theses.

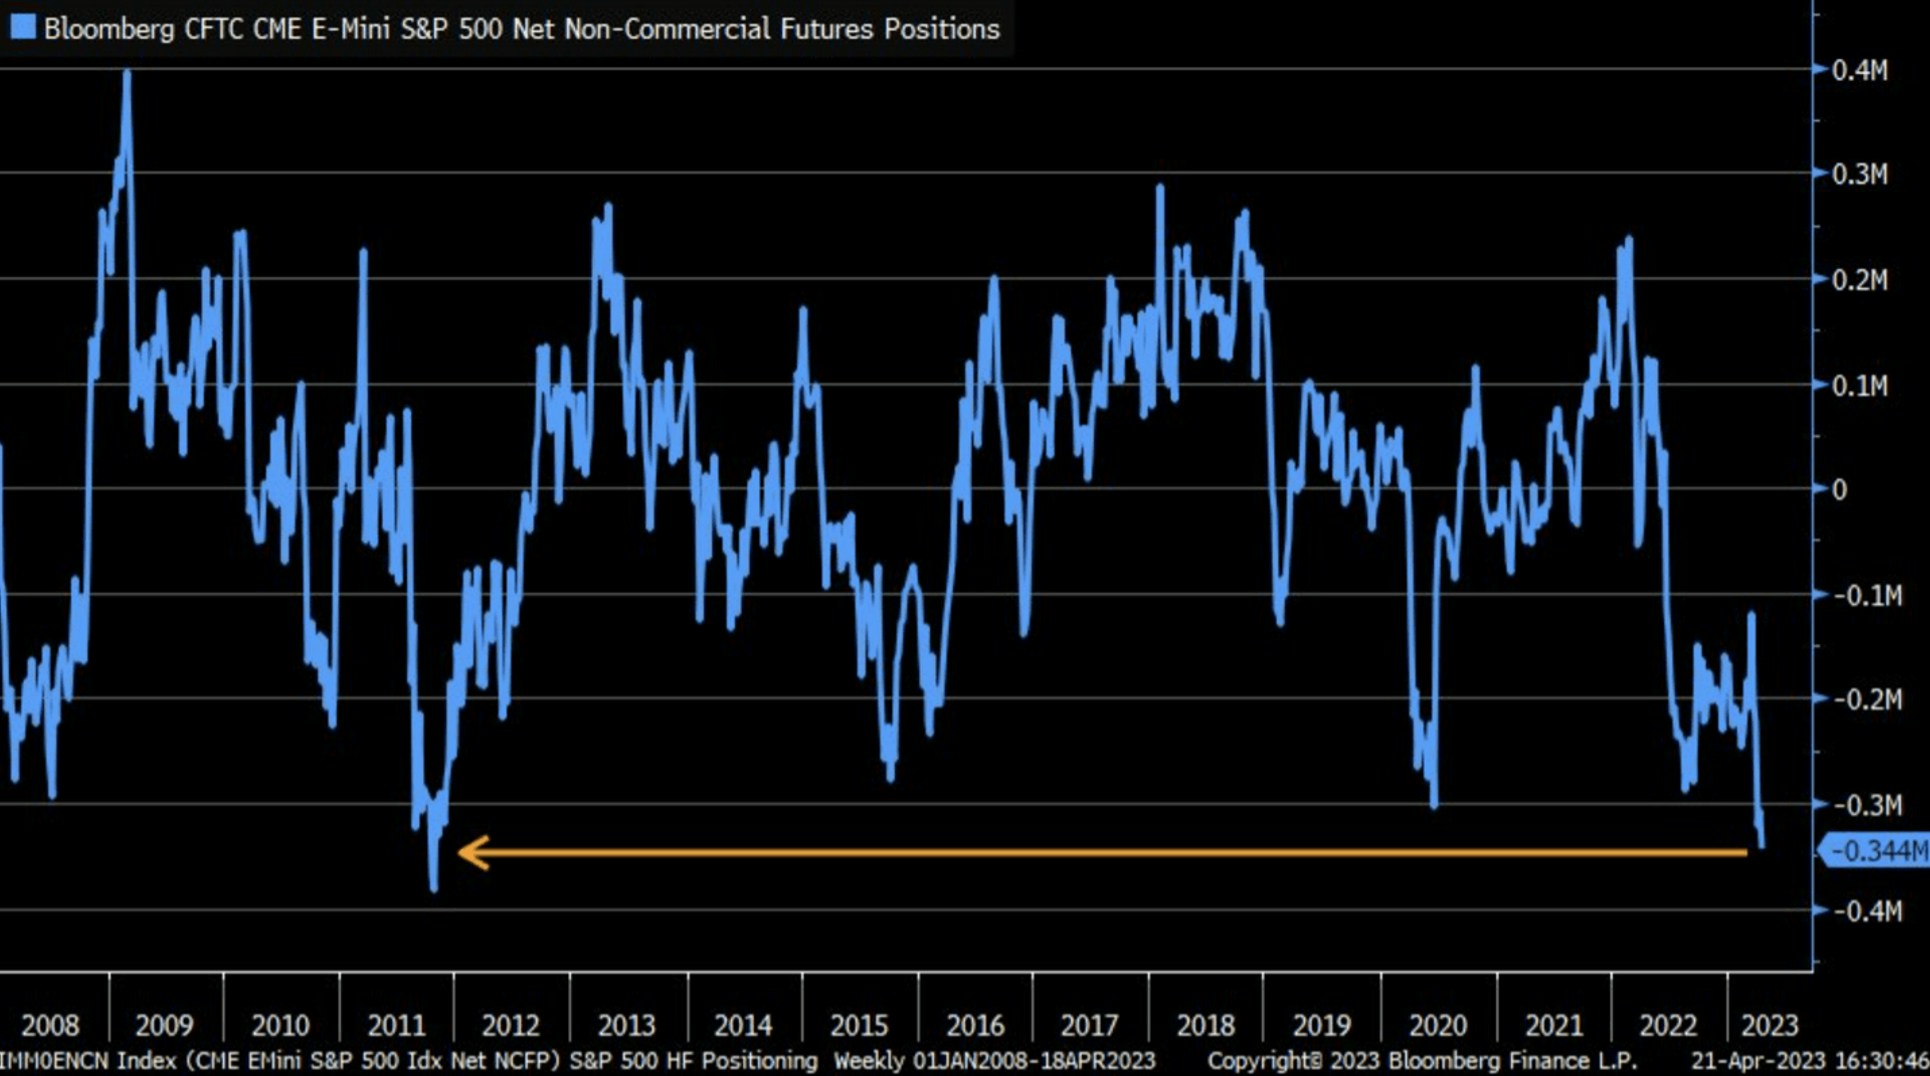
Source: Bloomberg
The other argument I hear from the bull narrative is that stocks are not crashing from the ongoing, negative news cycle. They instead appear to be climbing a wall of worry as we are now approaching the 4300-resistance level.
This bull thesis is worth considering, yet there is one important twist to this narrative that needs to be explained. The question is not: why is the market not breaking down on terrible news? The more important point that needs to be addressed is this: why is the market not breaking out in a meaningful way? With such an extreme allocation to short positions, as well as markets continuing to shrug off really bad news, it’s odd that we cannot meaningfully clear the 4280 – 4380 barriers.
I was beating the drum in mid-October and early November that a sizable rally was unfolding when the market was extremely bearish: “more and more signs are pointing to a bigger trend reversal underway. Several markets are in new uptrends and suggesting a push to new highs is on the horizon. This will lift all boats, but I do not expect all stocks/markets to make new highs. It’s important to identify the winners, and stick with them in these new uptrends.”
In our premium analysis, we went on a buying spree around this time, loading up on some of our leading positions. Today, after a sizable rally, we have raised a considerable cash position, and rebalanced our portfolio to coincide with the new macro that we are in.
We believe another reason the market cannot make up its mind is that the current macro environment is showing stubborn pockets of growth, which is keeping equities from falling. However, with stubborn growth comes stubborn inflation, which is preventing these markets from powering too much higher.
There’s plenty of evidence of this unhealthy bifurcation. For example, we’ve covered in the past that while Big Tech continues to power higher, underneath the hood, your more economically sensitive sectors, which tend to be early cycle sectors, are being sold aggressively.
If this is a new bull market, we need to see the coming volatility hold the SPX 3805 level and a rotation from Big Tech into these neglected sectors. This will be our signal to safely pivot for a renewed bull market.
The Macro Gamble the Bulls are Making
The chart below is looking at various economic metrics on a 3-month annualized basis. The reason I prefer this measurement is because we can see the current trend within the economy, as opposed to measuring the reading against an arbitrary month in the distant past.
The chart below helps to illustrate how pockets of growth in the US economy have stayed surprisingly resilient. Even housing is reaccelerating as well as the consumer. These are simply not the type of readings we see going into an imminent recession. This is fanning the hope that the looming recession will result in a soft landing, or possibly even no landing at all.

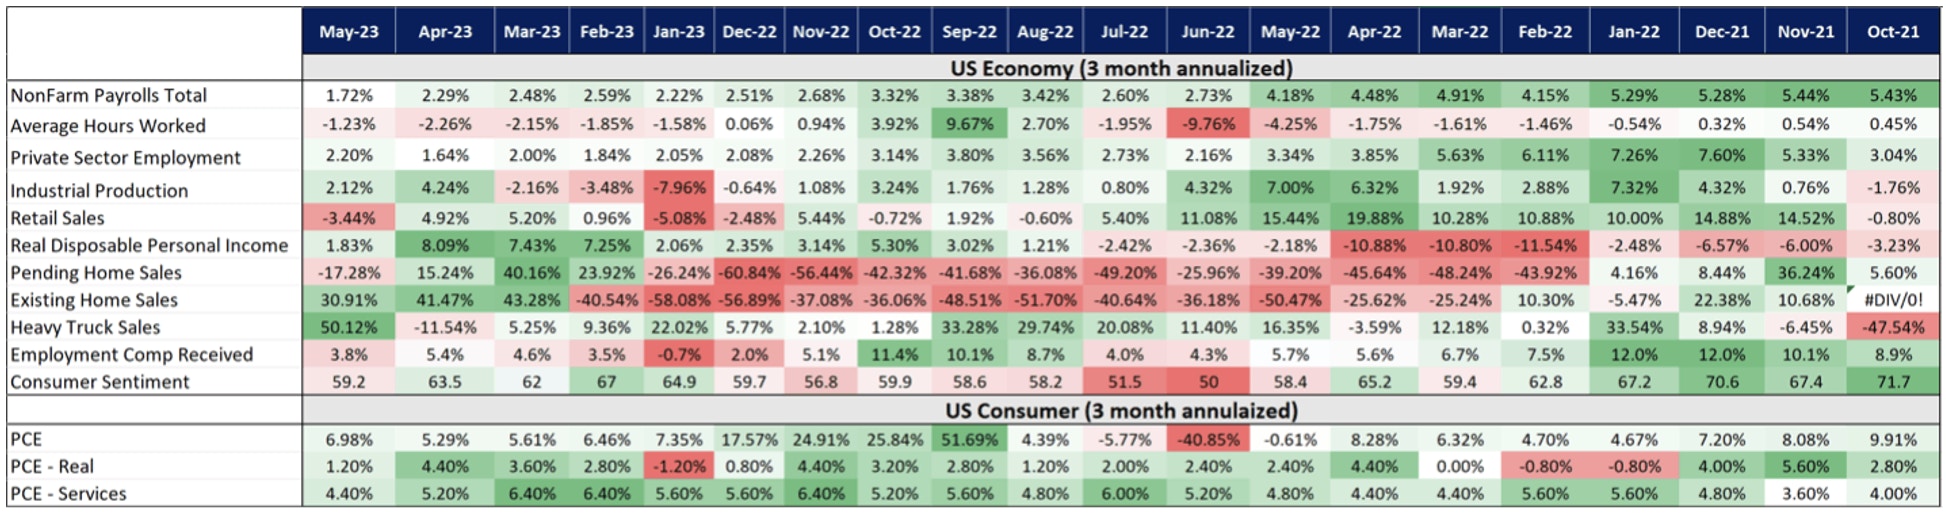
What these investors are failing to realized is that buoyant growth means buoyant inflation. In prior soft landing scenarios, like 2016, inflation was running well under the FED‘s 2% target, allowing them to keep rates next to 0 to defend declining asset prices. Today, the FED does not have this convenience, as inflation is far from their 2% target.

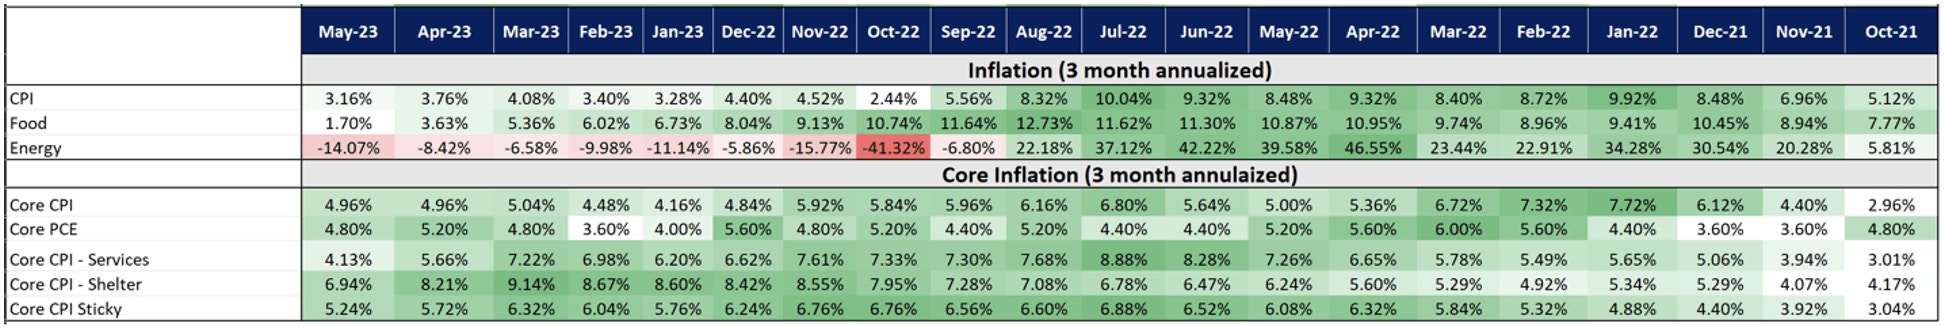
When we look at the same inflation metrics on a 3-month annualized basis, what investors should notice is how far away we are from the 2% target. In some instances, we are triple the desired target. These metrics have remained virtually unchanged for up to a year, while compounding sequentially.
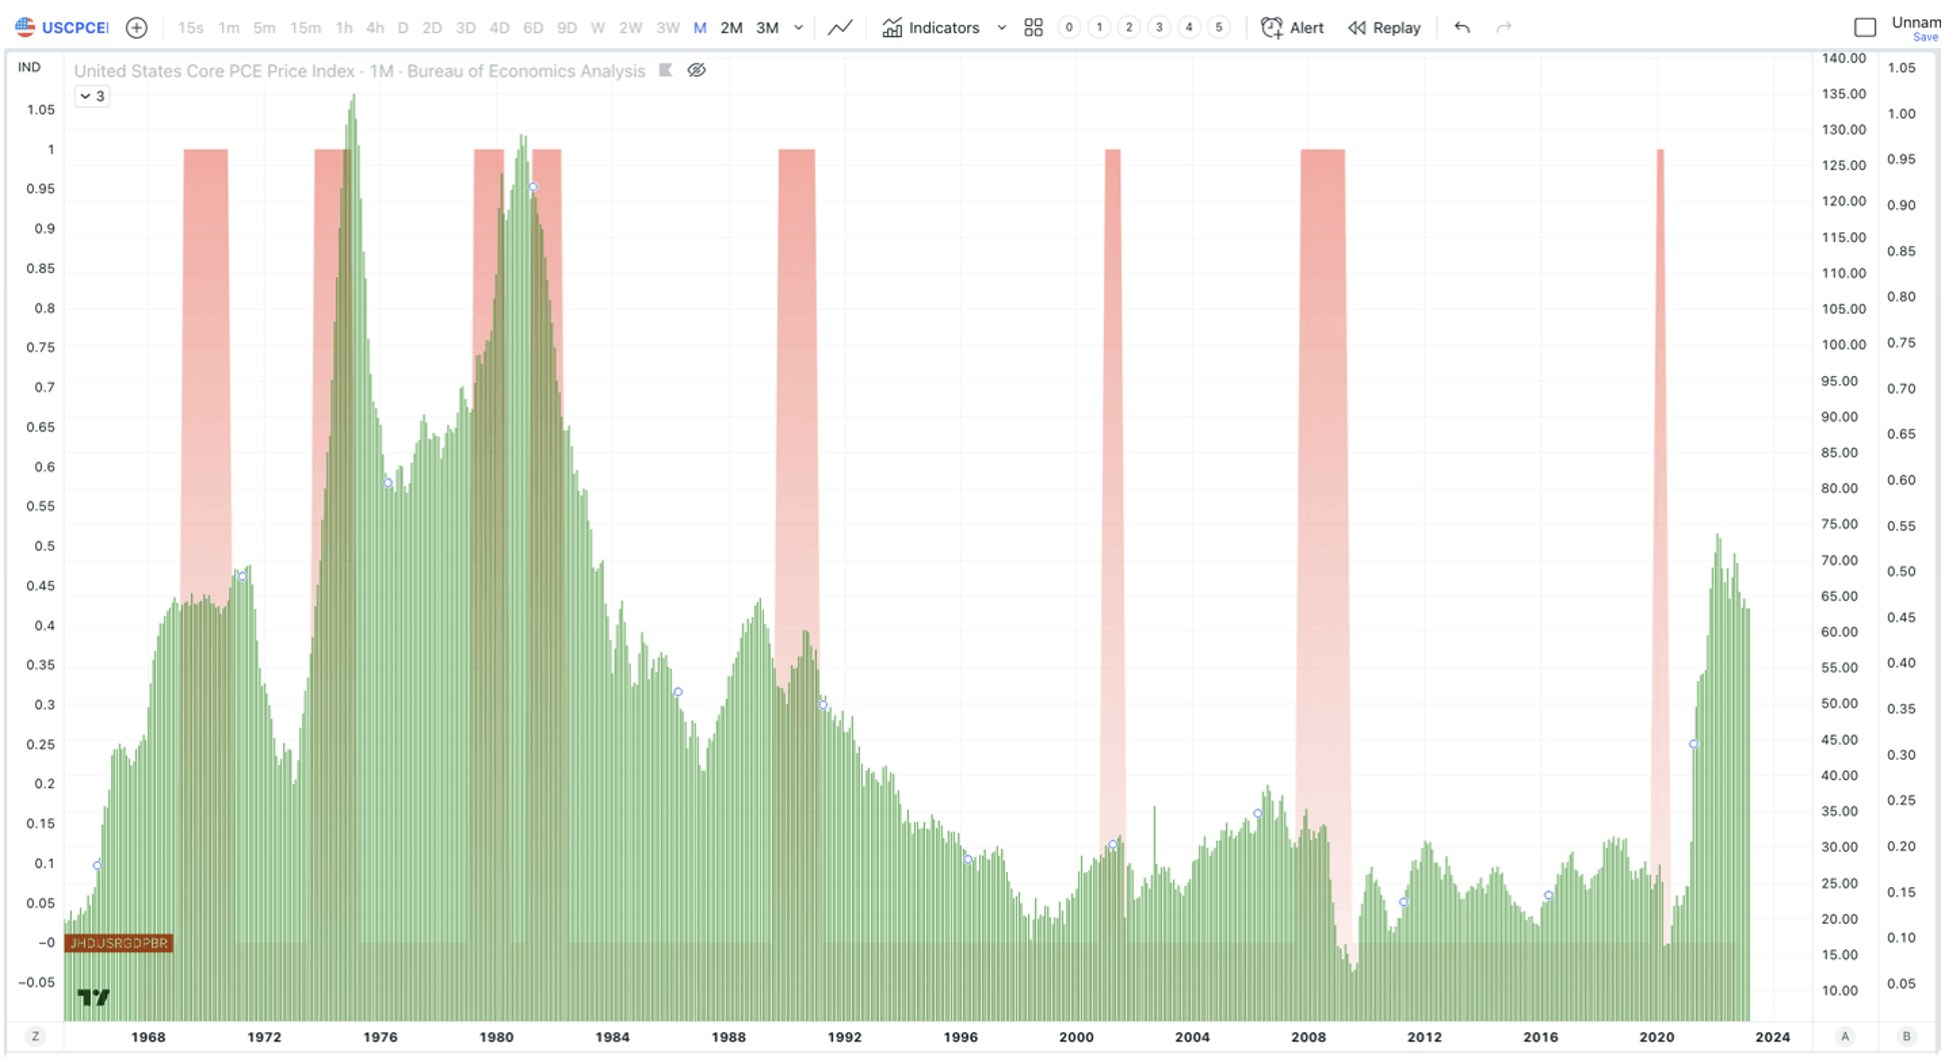
Peak inflation is behind us, but the real battle will be getting these numbers back to the 2% target. In fact, going back in history, there is no instance where core PCE inflation backs off from an inflation impulse without a recession.

The reason markets are not breaking out in a substantial way after the 2022 bear market is because as growth and the consumer surprise to the upside, inflation becomes more problematic. We expect the FED to continue their fight against inflation by continuing to raise rates into 2023. The more they raise, and the longer they stay elevated, the higher the odds are that something gets broken in the economy.
Two Scenarios; SPX 3805 is Important
However, we have to be open to all possibilities, which is why we rely on price action to be the final arbiter of our risk management decisions. Regarding, the broad market, here are two scenarios that I am tracking based on the structure from the October 2022 low. Both counts suggests that we are in the final swing before topping in a large degree correction. Where the two counts differ is on the depth of this drop. The blue count will break to new lows, likely targeting around 3000 SPX. The Red count will find support above 3805 SPX, and begin a strong uptrend to new highs in the coming years.

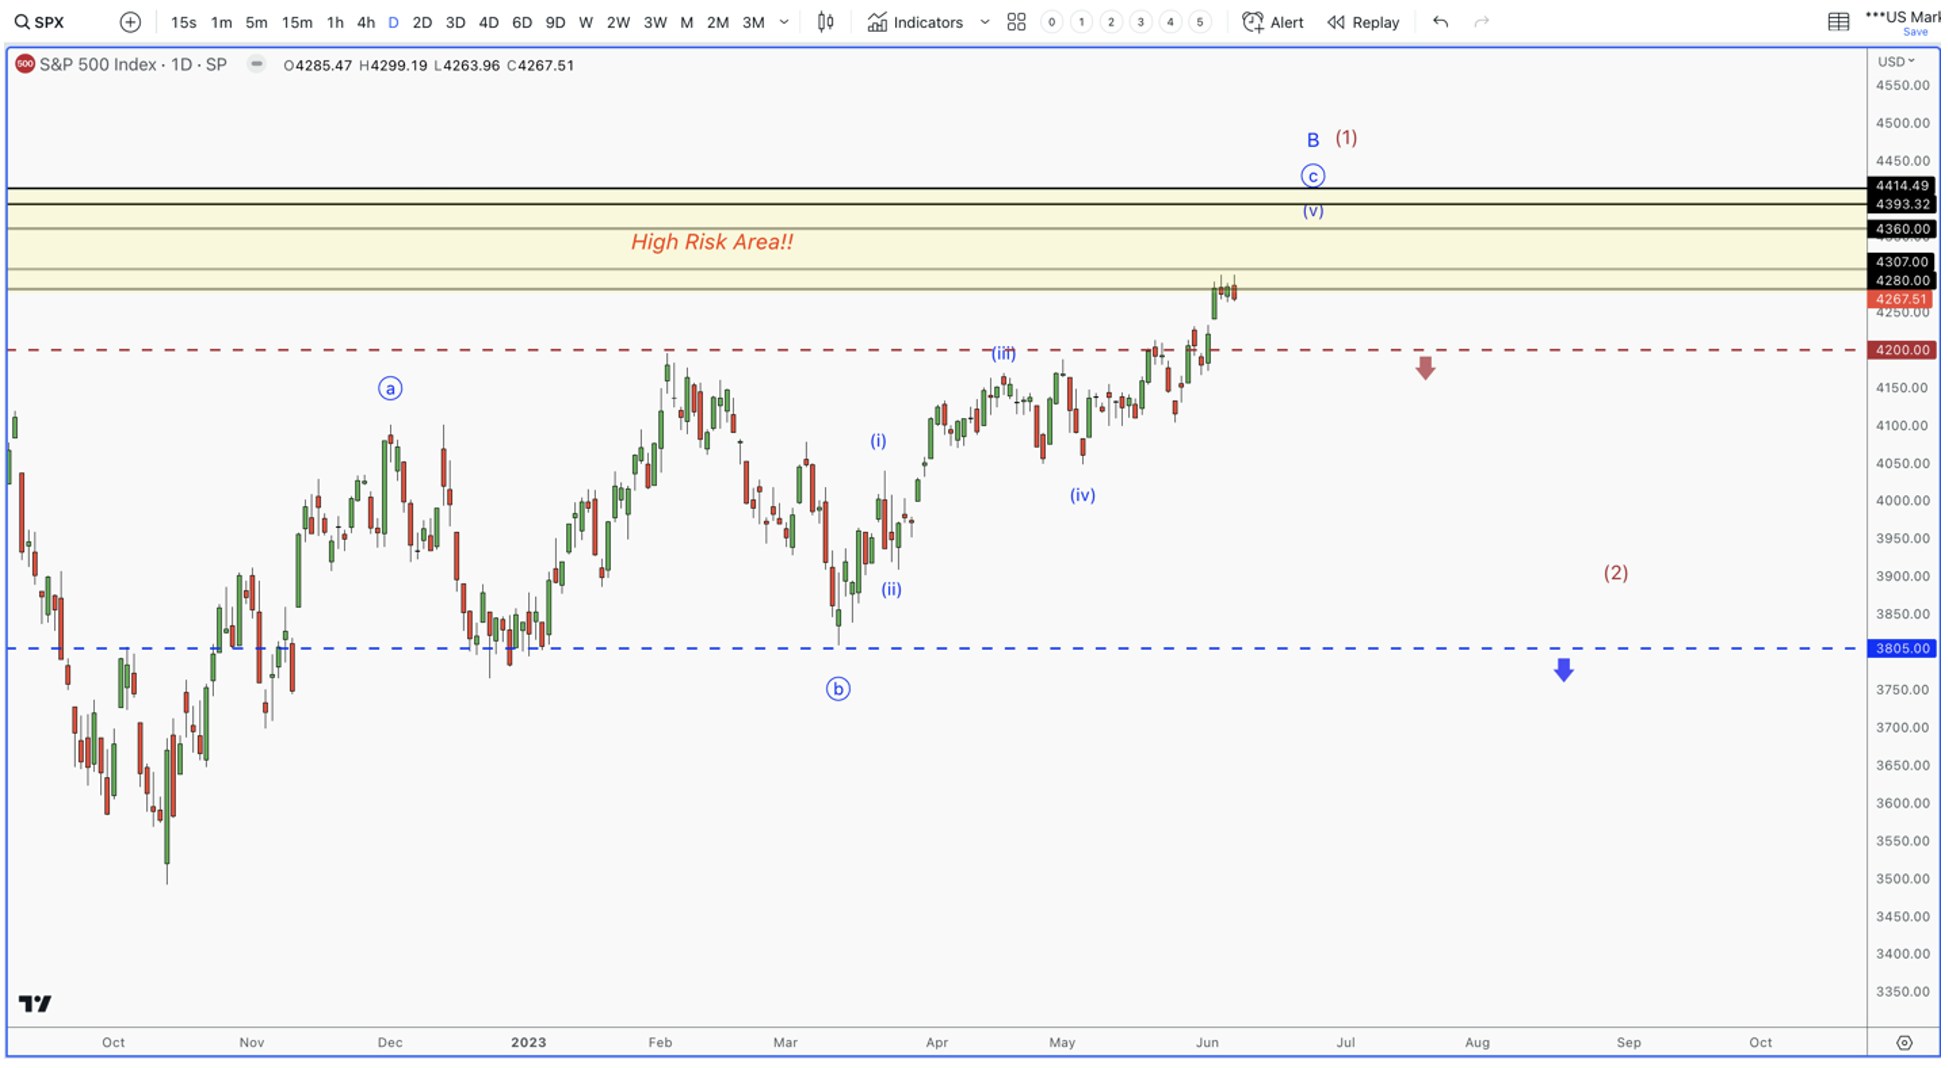
Both scenarios see volatility returning into the summer. If this is a new bull market, we not only need to see 3805 hold, but we will need to also see a rotation from Big Tech into more economically sensitive sectors/styles, like small caps, transportation, financials and the equal weighted S&P 500.
Sign up for I/O Fund's free newsletter with gains of up to 221% - Click here
Broad market breakouts tend to occur with most markets and sectors participating. Strong breadth expansion tends to equate to an improving economy. As a result, early bull markets tend to see economically sensitive sectors leading the way. This is simply not what we are seeing today, as the market piles into the perceived defensive Big Tech trade.
As of today, both Apple and Microsoft account for more than 14% of the S&P 500. In fact, over 25% of the S&P 500’s top 10 holdings are in Big Tech.

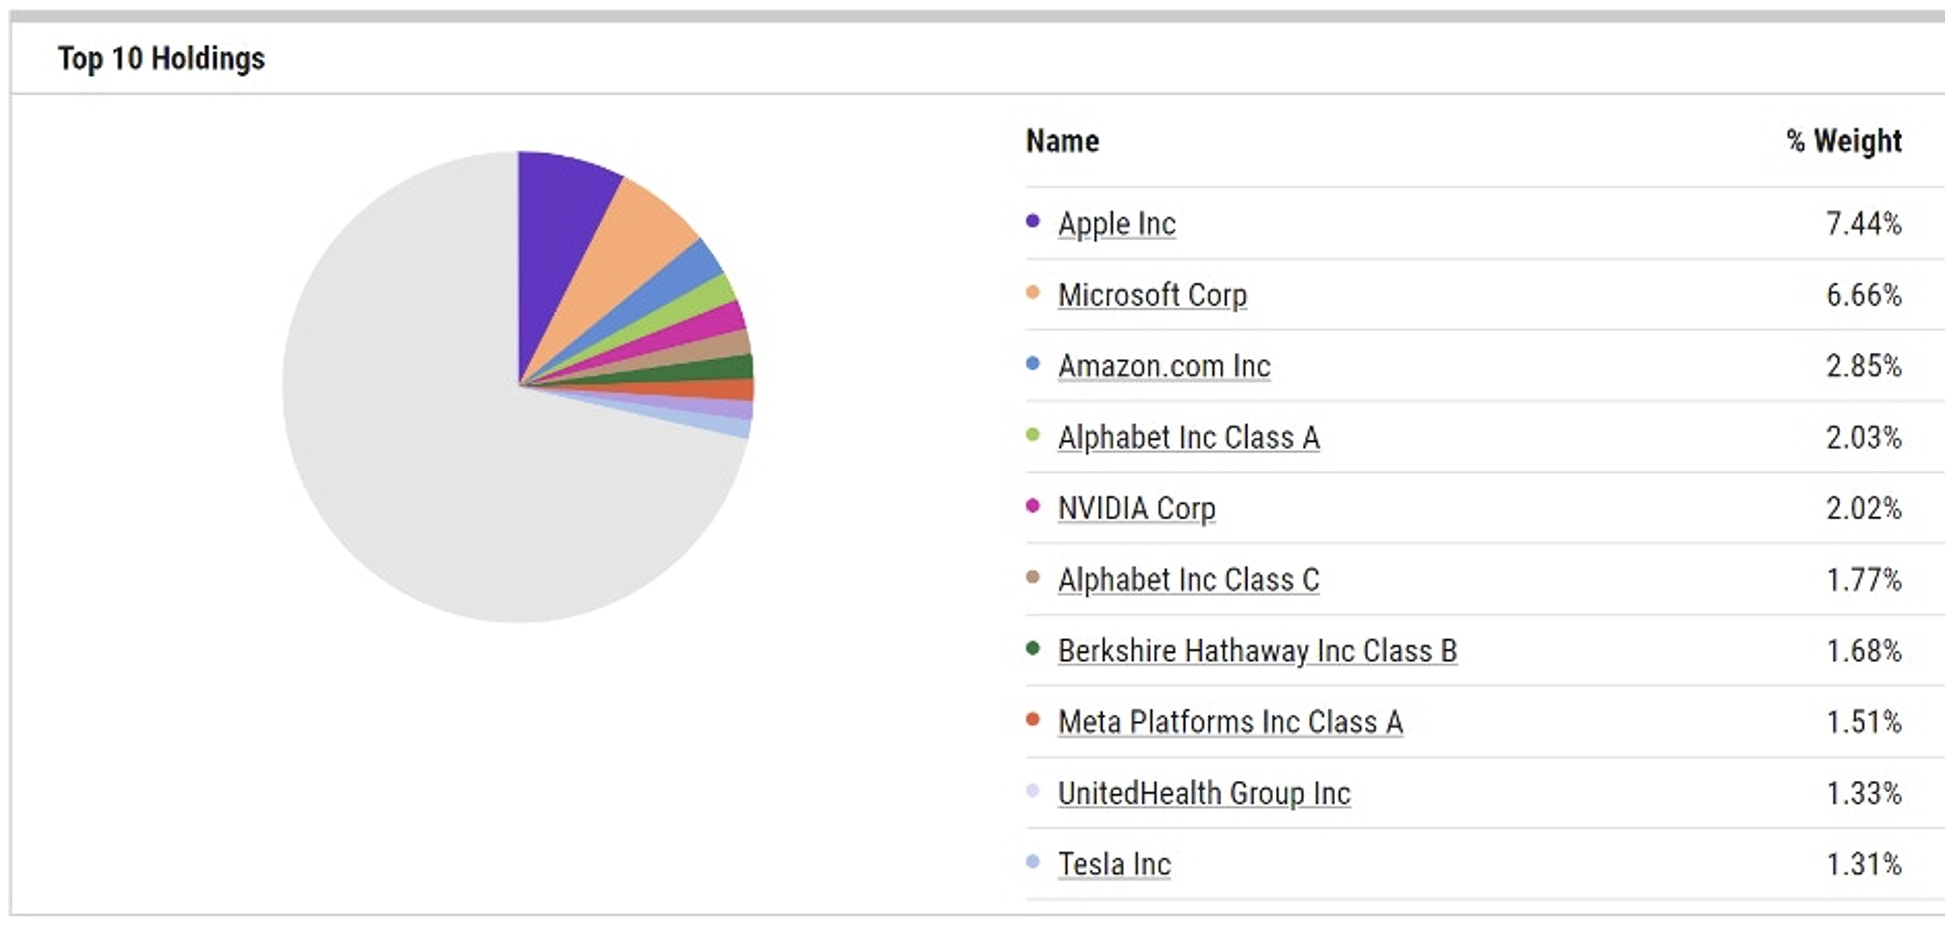
Source: YCharts
Furthermore, if we look at economically sensitive sectors, we are not seeing the type of relative outperformance that we tend to see in an early expansion cycle.
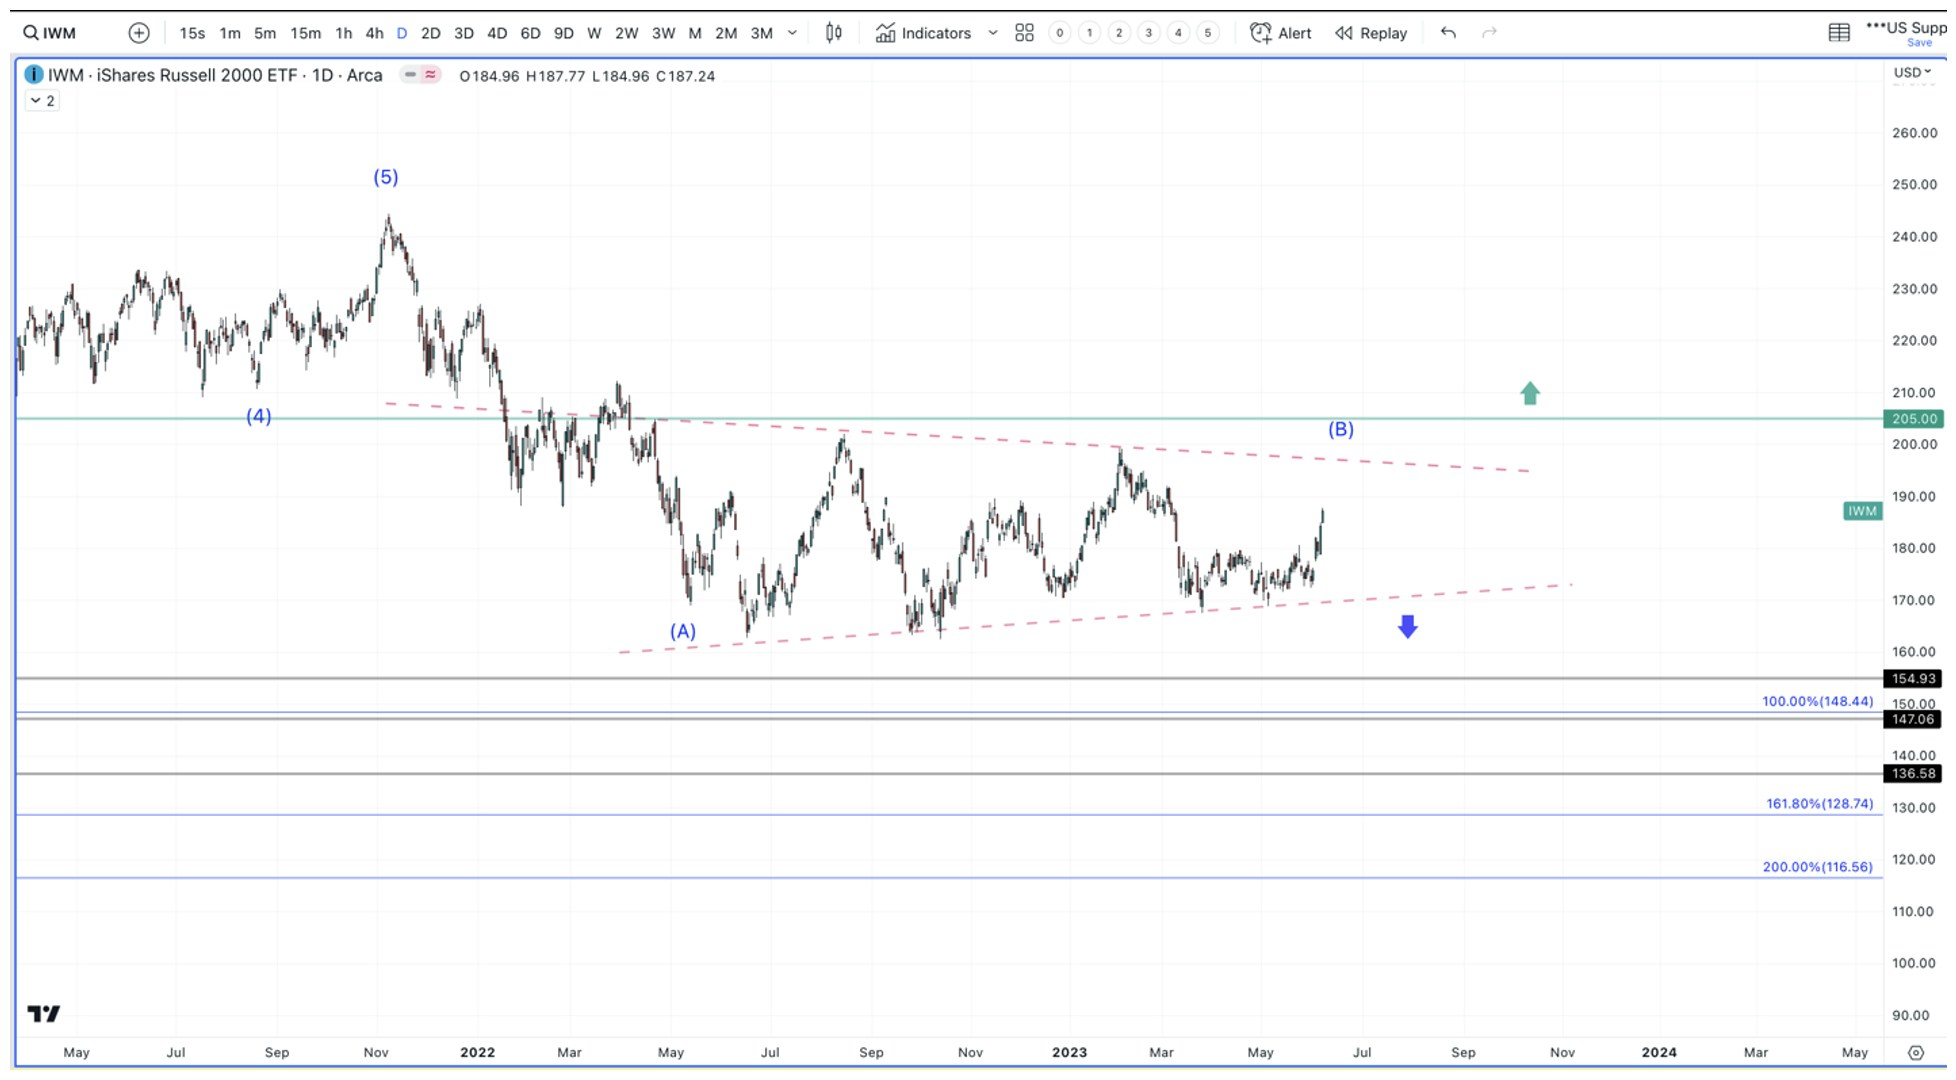
Small Caps (IWM)
Small Caps appear to be tracing a large triangle pattern. More times than not, these triangles tend to be the mid-point in a larger trend. The current bounce is expected, and as long as $205 holds, I’m expecting IWM to break below its October lows.

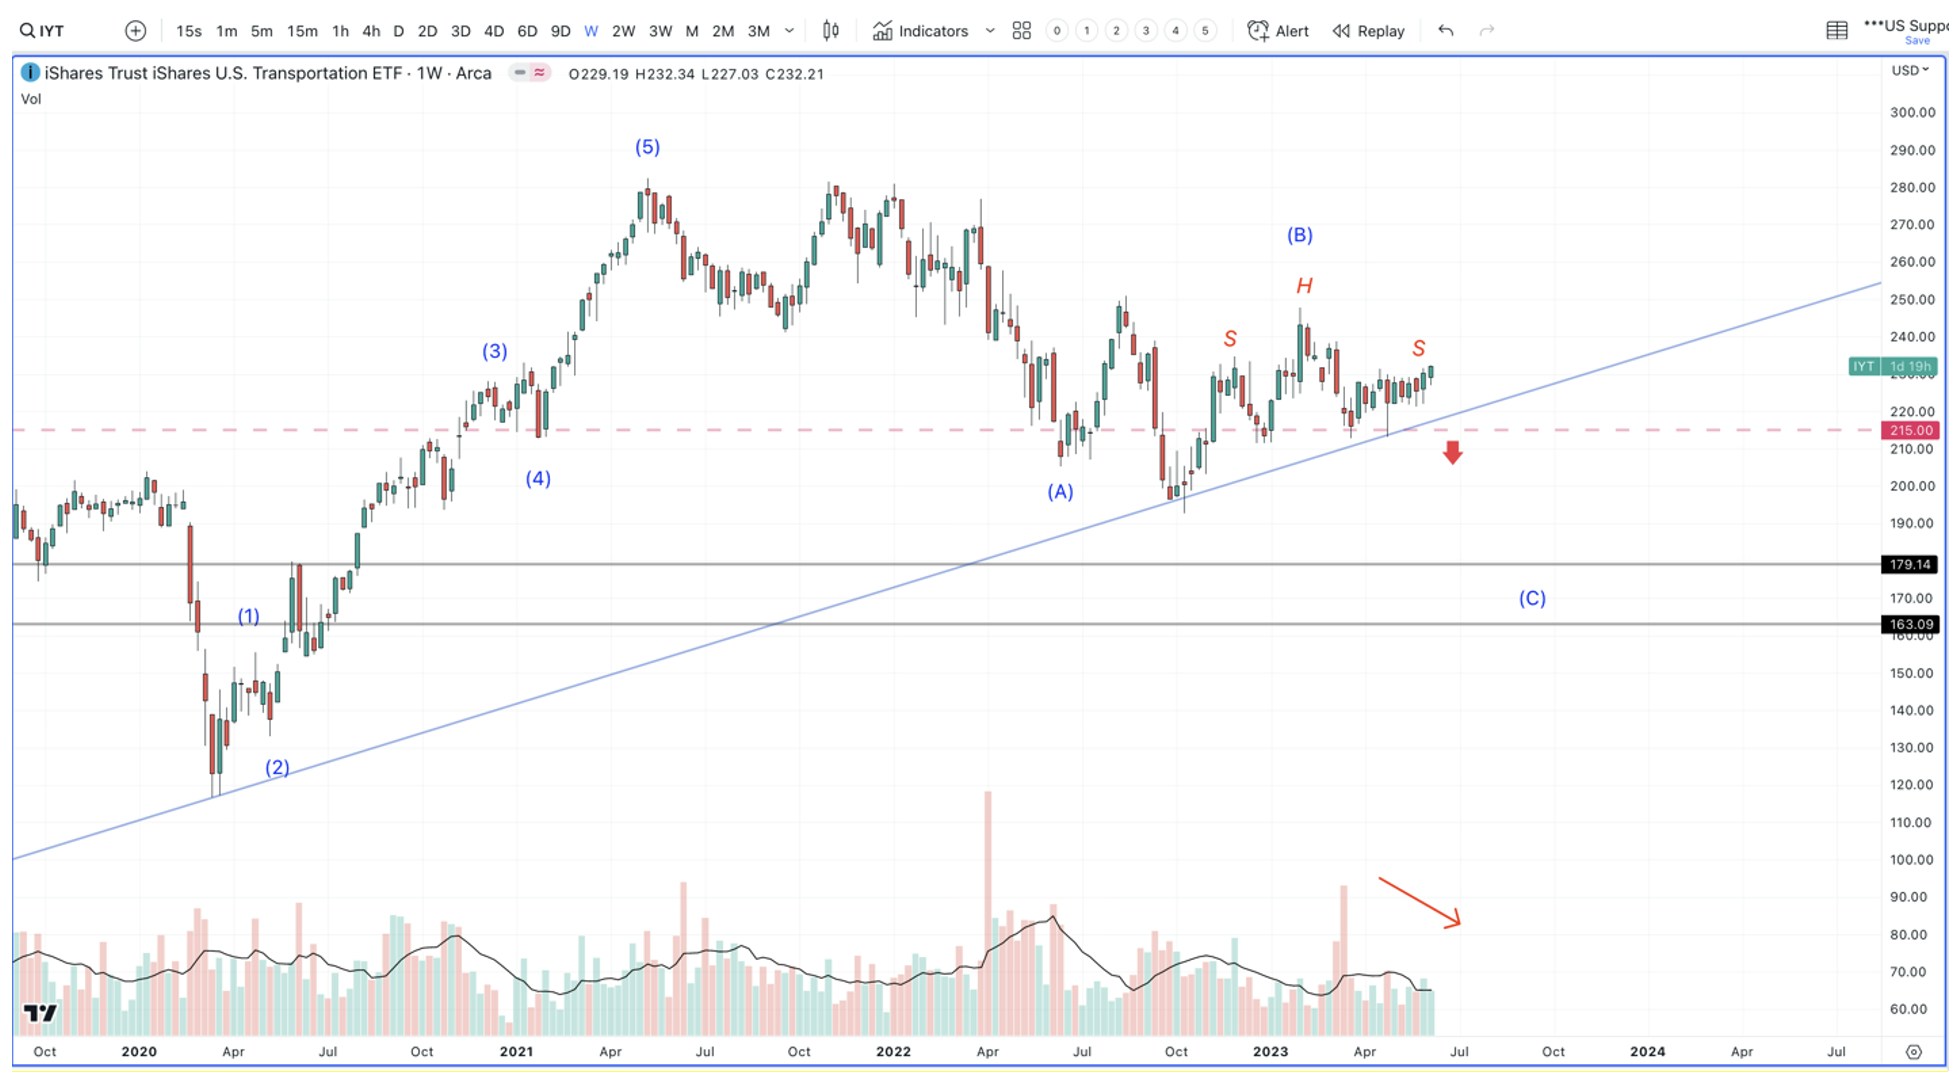
Transportation
Transportation stocks continue to falter in the current macro, suggesting that we are not starting a new growth cycle, yet. Note the head and shoulders pattern forming on weakening volume. If the trend line breaks that has held up transports since the COVID low breaks, a new leg lower will begin.

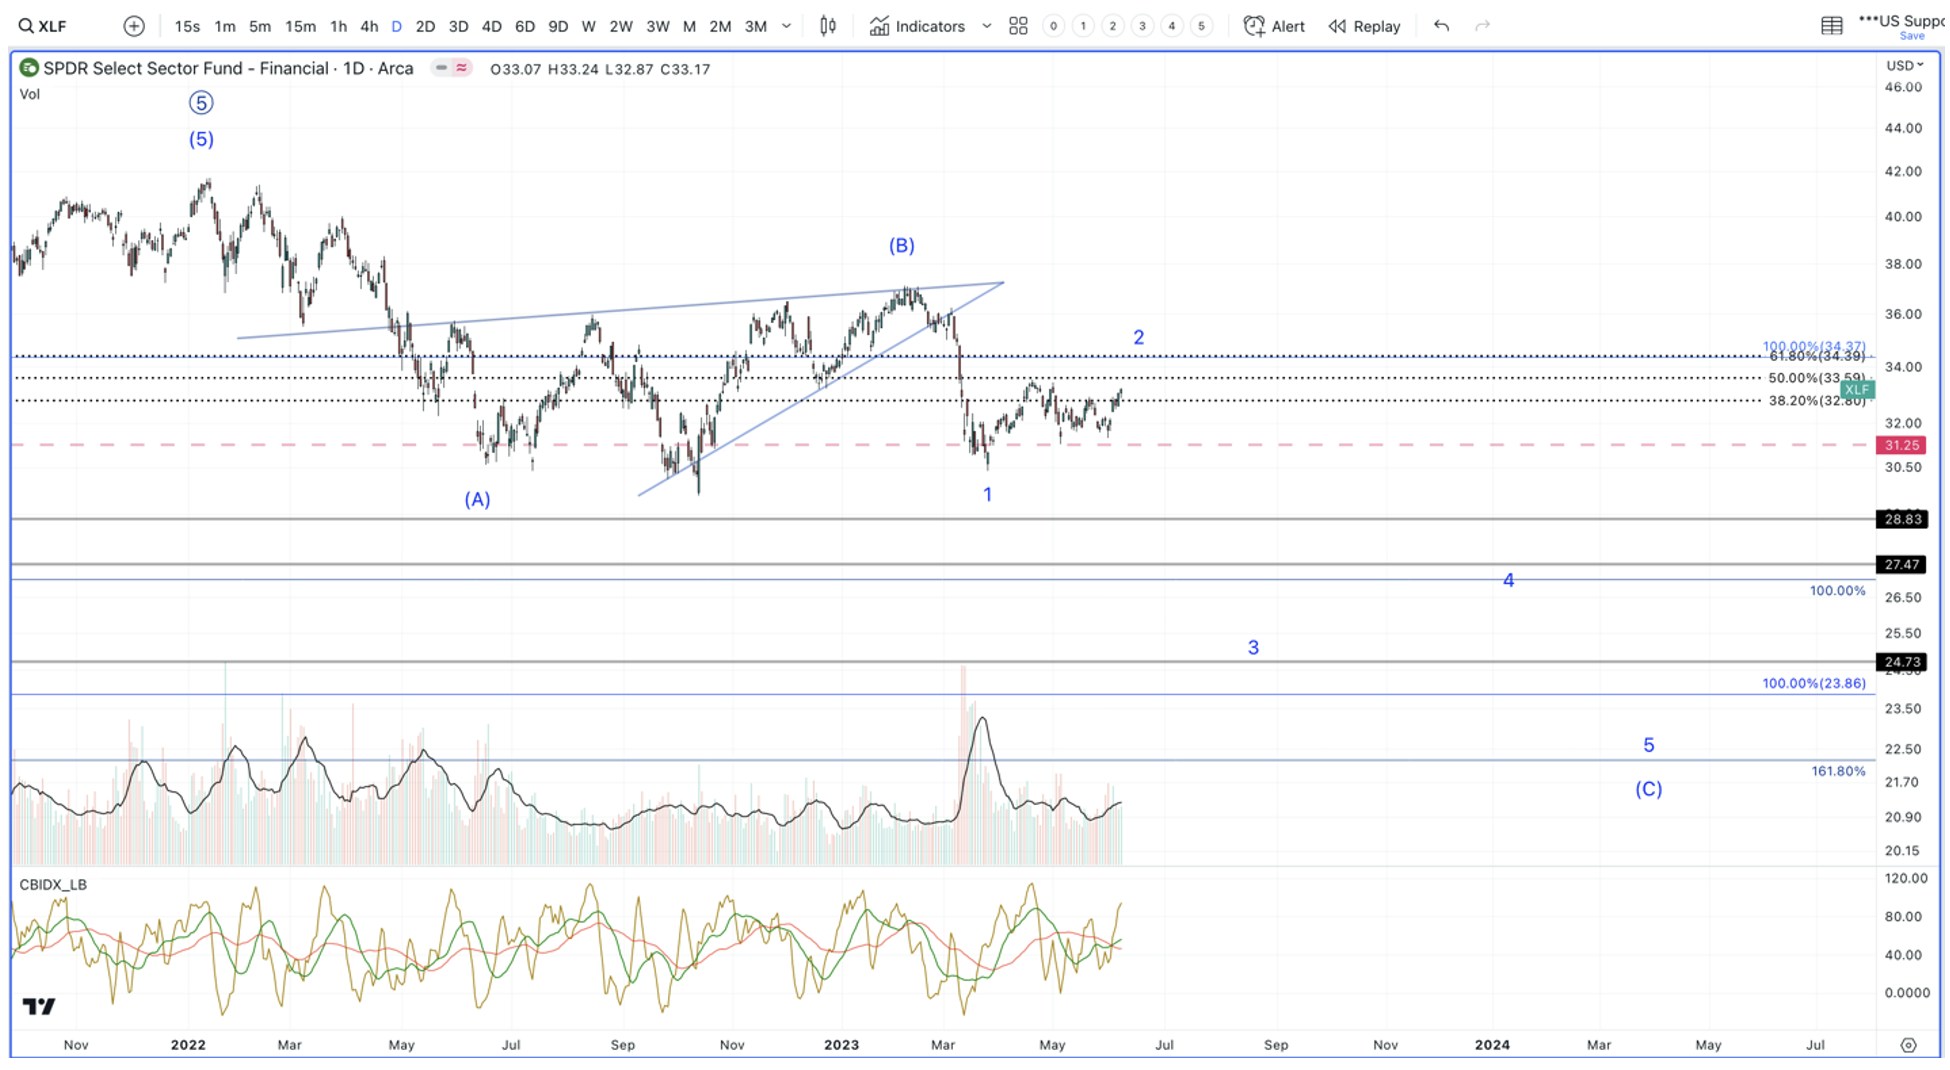
Financials
I tend to believe that financials are leading the market down, not Big Tech leading us up. The weakness can be seen outside of the regional bank stocks, which I’ve discussed in great detail here.
While everyone focuses on the regional banks, the financial sector that tracks the biggest financial institutions in the US looks quite unhealthy, as well.

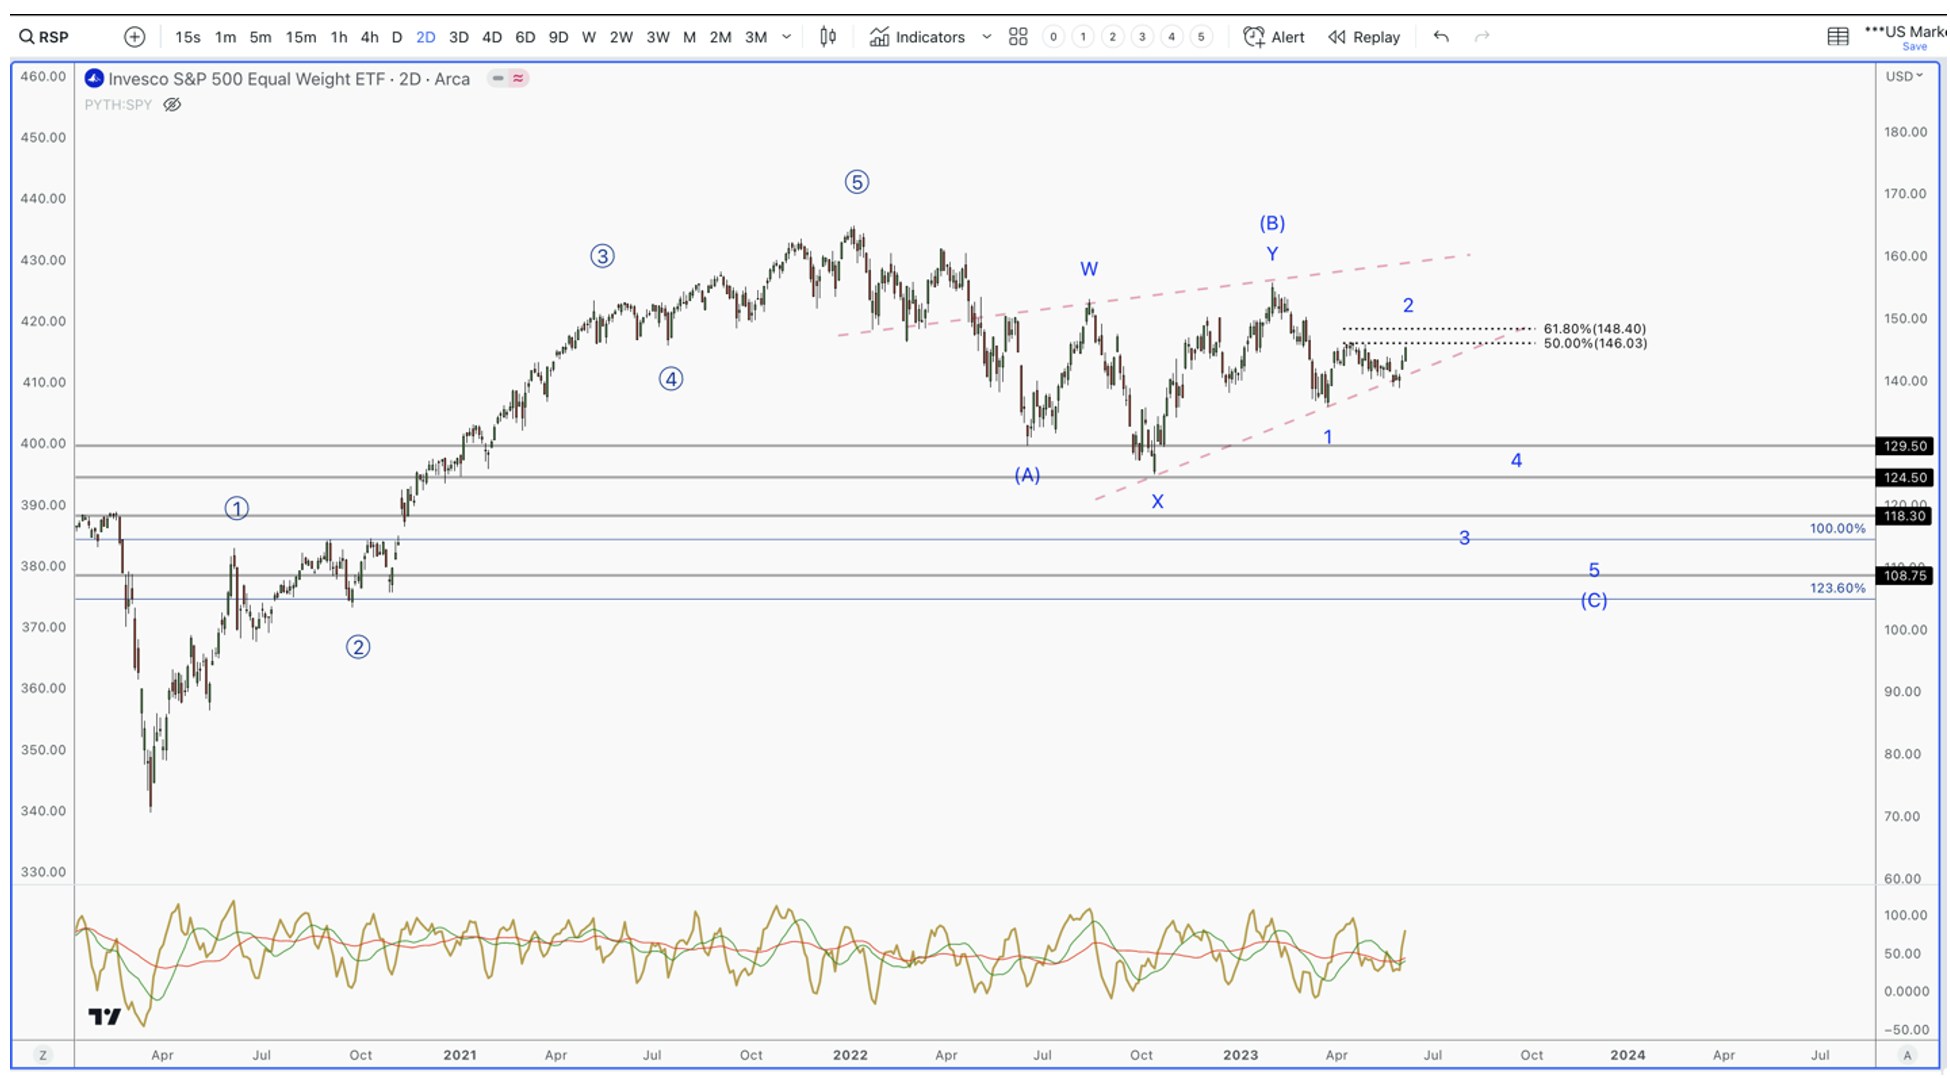
Equal Weight S&P 500 (RSP)
The Equal Weighted S&P 500 gives all 500 stocks in the index the same weighting. So, Apple, for example, has the same weighting as Home Depot. Because of this, in an expanding economy, this index tends to outperform the market cap weighted version. As of now, it is has made a series of lower highs since February while the Big Tech dominated S&P 500 has made a series of higher highs.
As of now, RSP is looking quite weak as it attempts to jump off of critical support. If the below trend line breaks to the downside, this index will likely be retesting its October low.

Conclusion
The main point I want to convey to investors is the more economically sensitive stocks and sectors appear to be setting up for a breakdown instead of a breakout. The markets have no reason to crash, as growth remains stubborn, but the piling into Big Tech while other sectors get sold is due to the fact that the FED cannot abandon their fight against inflation to support asset prices.
We are open to a new bull market being formed, which is our red count in the SPX chart above. In order for us to pivot, we will need to see the coming volatility hold 3805, and a rotation from Big Tech into the more economically sensitive areas of the market. This doesn’t mean tech won’t lead in a scenario where there is a rotation out of Big Tech, it only means that the market is seeing a soft landing and pricing that into equities.
The argument for the bulls is that the market is climbing a wall of worry, as the majority of the market piles into cash and short positions. We discussed the net short positions going back to 2011 to support this; however, if we pull this data back farther, we can see that the net short positions were even more extreme in late 2007.

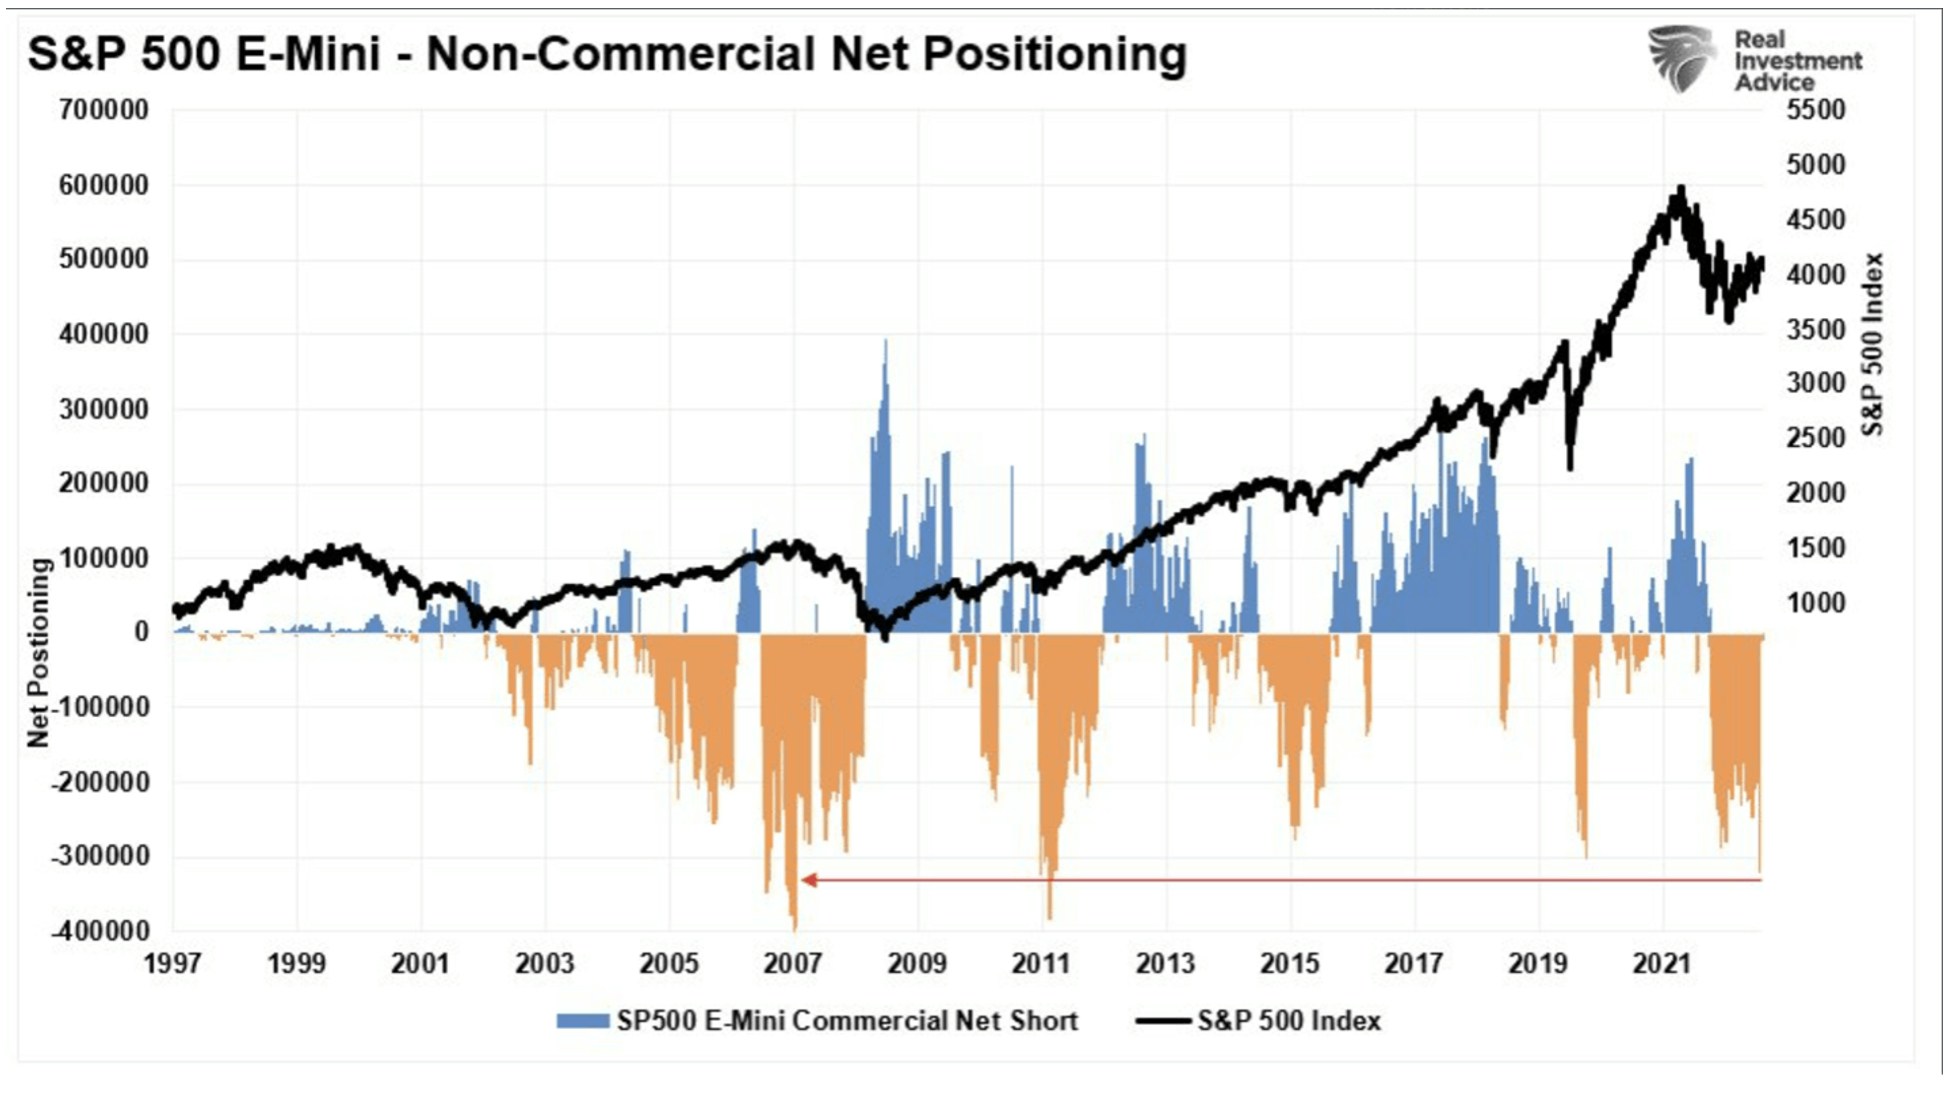
Source: Real Investment Advisors
That being said, there are times when the crowd is right. The damage done to the economy by the Fed’s fight against inflation will likely prove to be vast. We believe it is prudent to see how this next pullback manifests before getting too aggressive on the long side of this market.
The I/O Fund has been beating the drum about AI for 5 years. Now that it is here, we are targeting choice mid-cap to mega-cap names in the coming pullback. Once this exuberance runs its course, and the market gives up on AI, we will be buying the dip for this once-in-a-lifetime tech trend that is just starting. Join us next week, Thursday, 6/15, at 4:20 EST where we will go over the specific AI stocks we are targeting. We will provide the macro backdrop, along with entry prices.
Disclaimer: This is not financial advice. Please consult with your financial advisor in regards to any stocks you buy.
Recommended Readings:


More To Explore
Newsletter

Big Tech’s Free Cash Flow is Turning Negative – Who's Next?
Big Tech’s AI revenue is accelerating, but free cash flow is moving sharply in the opposite direction. Across Google, Microsoft, Meta and Amazon, capex is rising much faster than operating cash flow a

Big Tech Earnings Preview: Is AI Monetization Finally Catching Up to Capex?
The most pronounced difference between 2026’s tech rally compared to rallies in the past is which companies have been left out of it. The names most associated with the AI trade have hardly participat

Nvidia, CXL, and the Battle to Improve AI Inference Economics
This is Part 2 of our two-part series on AI inference economics. In Part 1 — Why Nvidia's Next AI Battle Is About Tokens per Watt, we laid out why tokens per watt has become the defining metric for in
Why Nvidia’s Next AI Battle Is About Tokens per Watt
As hyperscalers move from building AI infrastructure to monetizing it, tokens per watt helps to reflect if revenue is scaling and if profitability is improving. Offload engines can increase tokens per
Micron Is Up 900%. Here’s Why the AI Memory Trade May Still Have Room to Run
Over the past 10 months, memory chip stocks have gone from being solid beneficiaries of the AI boom to capturing a massively outsized piece of the return pie. The inflection in Micron’s performance de
Why the S&P 500 Shrugged Off the Iran War — and What Could Finally Break the Rally
On February 28th, the U.S. went to war with Iran, and the market was handed the kind of shock it hasn't contended with for years. The conflict set off a chain reaction across the region: an ongoing su

Nvidia, CoreWeave, and Nebius: Inside the Circular Financing of the GPU Boom
Neoclouds are one of the more hotly debated AI business models, with CoreWeave and Nebius being the two most widely recognized names. These companies have seen their sales, backlog, and share prices s

AMD, Nvidia, Arm, Intel: Inside the $120 Billion CPU Gold Rush
CPUs have gone from an afterthought to becoming the AI trade’s next great bottleneck – and with AMD, Nvidia, Arm and Intel circling a market that is doubling nearly overnight, the only question left i

Google TPU v8 vs Nvidia: How Inference Is Rewriting the AI Market
In April, Google announced it would begin selling its TPUs to select third-party data center operators, which is something the market has anticipated for nearly a decade. The TPU-versus-Nvidia-GPU deb

The AI Networking Stock That Beat Nvidia by 7X YTD for Returns of 135% YTD
AI networking stock Lumentum is among the key I/O Fund winners in 2026. We allocated heavily to LITE in January—a month before Nvidia backed the company. While most investors couldn’t stomach taking a
