This article was originally published on Forbes on Dec 7, 2023,10:58pm EST
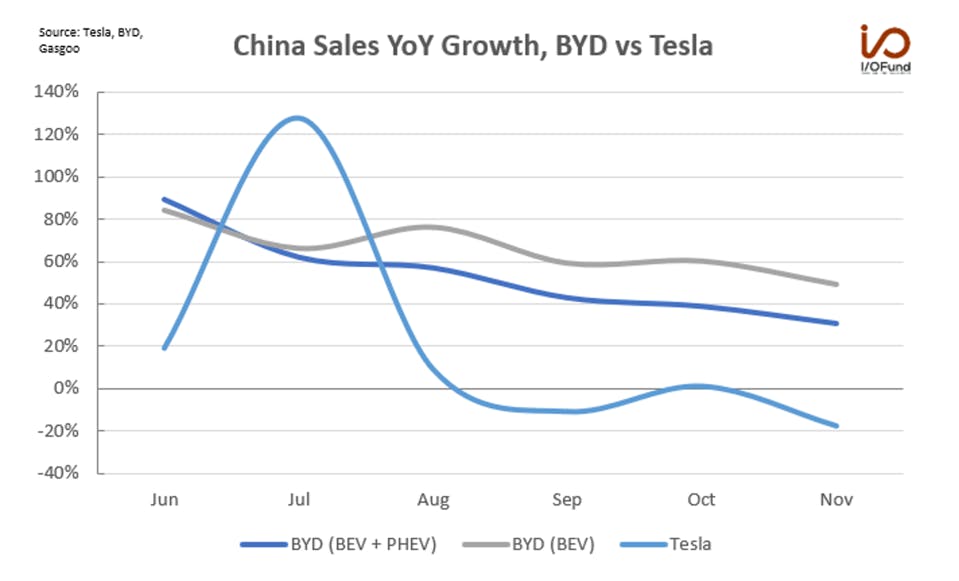
Tesla’s China struggles are persisting, as the American OEM saw its monthly sales decline substantially year-over-year in November, continuing a string of weak growth that began in August.
Tesla’s primary China rival BYD continues to see solid vehicle sales growth, and is poised to potentially become the market share leader in Q4. In an analysis last month “Tesla Sells 33% of Vehicles Below Average Cost, BYD Pulls Ahead,” our firm had reported that BYD more than doubled Tesla’s China sales in October and that BYD “is set to overtake Tesla in terms of quarterly BEV deliveries.”
Sign up for I/O Fund’s free newsletter with gains of up to 221% – Click here
Tesla Falls Further in China
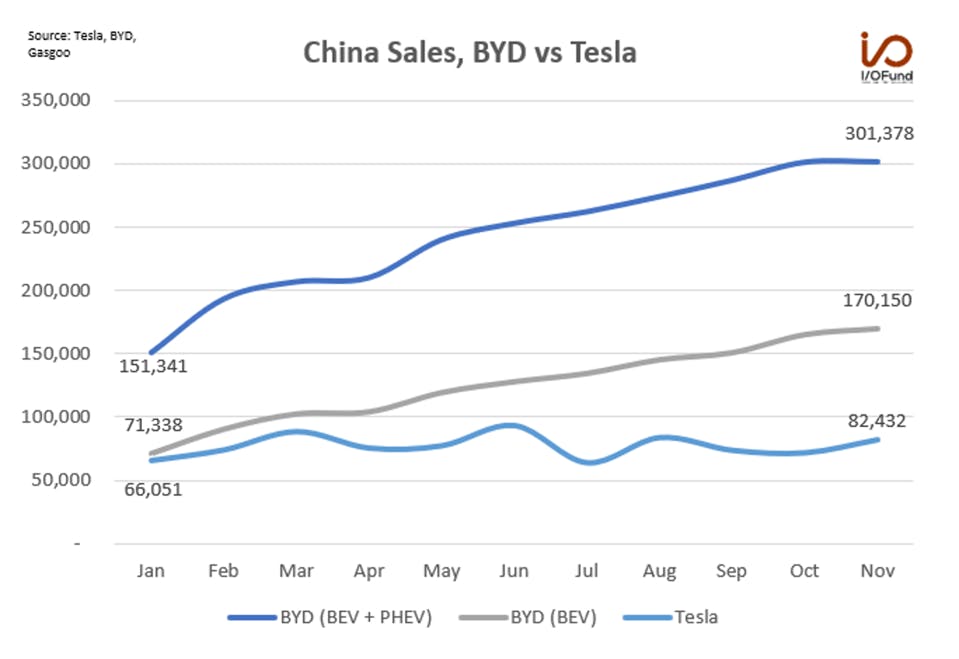
In November, Tesla’s China-made EV sales fell about (-17.8%) YoY to 82,432 vehicles, marking the largest YoY drop since December 2022 when Tesla cut output and prices in response to rising inventories.
Vehicle sales did increase approximately 14.3% MoM from October, a positive sign of improvement from the stagnation seen since the peak in June at 93,680 vehicles. Despite the 14.3% MoM growth, Tesla is still tracking at less than half the BEVs as BYD and will need much more than one month to maintain its lead globally.
Source: TESLA, BYD, GASGOO
November and December are typically the strongest seasonal months for China’s EV market, a common theme seen in other auto manufacturers’ deliveries for last month. December has also tended to be the strongest month for Tesla — aside from in 2022 — so the true test for Tesla will be exceeding June’s total as December has traditionally done in the past. That would represent MoM growth of ~13.6% and YoY growth of ~67.9%, a reversal back to double-digit growth after a 4-month string of weakness.
In 2021, Tesla saw similar weakness in October and November that then set up for a strong December. 2023 could follow that pattern with a strong December boosted by the refreshed Model Y and Model 3 Highland – Tesla will need to show at least 95,000 units in volume in December (or a minimum of 50% of BYD’s BEV volume) for the bullish thesis but if it misses under 90,000 then China continues to be too big to ignore, and we will look for an opportunity to buy lower. We are on the sidelines until then.
Source: TESLA, BYD, GASGOO
I/O Fund Equity Analyst Damien Robbins previously reported last month that Gigafactory Shanghai “is essentially maxed out in terms of the volume of vehicles that it can churn out, so October’s stagnation raises more questions about how Tesla will regain market share in China. With BYD’s strong growth in Q3 and Tesla’s slide in September, the American EV maker saw its NEV market share fall more than 300 bp QoQ from 12.98% in Q2 to 9.89% in Q3.”
October’s stagnation saw Tesla’s market share deteriorate further: Reuters reports that Tesla’s “share of the country’s EV market dropped to 5.78% in October from 8.7% in September.” That marks a swift decline in market share – down 1220 bp from Q2’s 12.98% in just over a quarter.
Tesla’s market share is sliding as Tesla’s deliveries are lagging and rival deliveries are growing; Tesla’s October sales grew 1% YoY compared to 30.1% YoY for the passenger EV market. For November, EV sales are estimated to increase 29% YoY to approximately 940,000, per the China Passenger Car Association. A CPCA official said that “every carmaker is making a dash to the year-end as they try to meet their sales targets.” In November, Tesla’s below-market growth rate of (-17.8%) YoY compared to 29%, is looking to set the carmaker up for further market share losses as Chinese domestic rivals’ deliveries continued to witness strong growth:
BYD’s NEV sales reached a record and second straight month above 300,000, with BEV sales rising 49% YoY to 170,150.
Great Wall’s NEV sales rose for an eighth consecutive month, rising 143% YoY to 31,824 vehicles.
Changan’s NEV sales increased nearly 53% YoY to 50,598.
Get Our Free Weekly Stock Newsletter
Get weekly stock insights, market analysis, and technology updates straight to your inbox.
Weekly stock insights
Market analysis
Technology updates
GAC’s NEV sales grew 49% YoY to 50,231 for the month and 80% YoY to 490,925 YTD.
Every Thursday at 4:30 pm Eastern, the I/O Fund team holds a webinar for premium members to discuss how to navigate the broad market, as well as various stock entries and exits. We offer trade alerts plus an automated hedging signal. The I/O Fund team is one of the only audited portfolios available to individual investors. Learn more here.
BYD Matches Tesla’s BEV Market Share
Due to China’s large population and the importance of this country in terms of demand, BYD is set to surpass Tesla on global sales next quarter.
BYD’s EV growth flatlined in November on a MoM basis, with growth just below 1% from October’s levels. However, November’s tally of 301,378 vehicles (BEV+PHEV) marked a second straight month with more than 300,000 deliveries. For a direct comparison to Tesla, BEV sales increased 49% YoY and nearly 3% MoM to 170,150 units, taking Q4’s to-date total up to 335,655 vehicles. As a result, BYD is poised to overtake Tesla’s BEV sales in Q4 – BYD is on track to surpass 500,000 BEVs delivered, whereas Tesla is forecasting a volume of at least 449,000 vehicles in Q4 to reach its 1.8 million target for 2023.
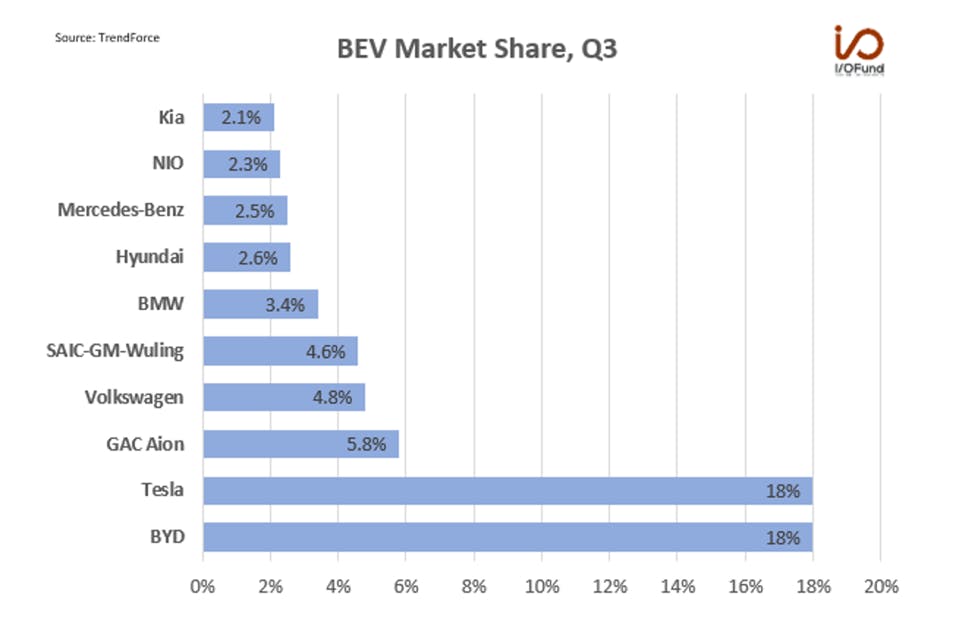
Source: TRENDFORCE
With BYD’s strong growth through Q2 and Q3, combined with a strong start to Q4, it’s also on track to soon become the top brand globally in terms of BEV market share, taking the throne away from Tesla. On a YTD basis up to Q3, Tesla held approximately 20.1% share of the BEV market, compared to BYD’s 15.9% share; however, in Q3, BYD matched Tesla’s market share at ~18%, per TrendForce data.
The team at the I/O Fund strives to be early and objective, highlighting last month for our readers that Tesla was set to lose market share to BYD as China growth stagnates. Read that analysis here.
For Q4, BYD is set to surpass Tesla’s delivery tally by 10% or more, based on current growth rates and seasonal strength. Some of China’s major EV brands, including BYD and Li Auto among others, “have either cut prices or increased the royalties for customers since late November to boost year-end sales,” which could help BYD further extend such a lead.
Tesla is heading towards a weaker position in China than what mainstream media is currently reporting as vehicle deliveries in the back half of the year have been relatively weak, allowing main rival BYD to catch up rather quickly, to the point where it may overtake the top spot in terms of market share. If not in Q4, then it looks to be inevitable come 2024.
China is a core market for Tesla for production, deliveries and exports, with Gigafactory Shanghai accounting for ~52.1% of Tesla’s 1.32 million total deliveries through Q3. Though Tesla has been raising Model Y prices over the past month, this slippage in market share raises concerns that margins will continue to suffer through Q4 and into 2024.
I/O Fund Equity Analyst Damien Robbins contributed to this analysis
Please note: The I/O Fund conducts research and draws conclusions for the Fund’s positions. We then share that information with our readers. This is not a guarantee of a stock’s performance. Please consult your personal financial advisor before buying any stock in the companies mentioned in this analysis.
Beth Kindig is the lead tech analyst for the I/O Fund with audited results that beat Ark in 2020 and returns of up to 1700% on her premium site in two years and 1150% in her free newsletter in three years on individual stocks and assets.