Tesla Sells 33% Of Vehicles Below Average Cost, BYD Pulls Ahead
November 14, 2023

Beth Kindig
Lead Tech Analyst
This article was originally published on Forbes on Nov 9, 2023,09:23pm EST
BYD more than doubled Tesla’s China sales in October as Tesla’s sales slipped on a month-over-month basis, while NEV startups showed strong sales numbers across the board. China’s new energy vehicle (NEV) industry continues to exhibit solid momentum, with September seeing NEV sales rise about +22% YoY and October estimated to see around +34% YoY growth. As a whole, China is expected to once again be the primary driver of global EV sales this year, with volumes forecast to reach or exceed 8.5 million units, or more than 60% of the projected 14 million global volume.
Tesla has been in the spotlight recently — its margins have contracted significantly over the past few quarters as it prioritizes price cuts. China is Tesla’s most important market as it currently represents the highest remaining total addressable market (TAM), therefore the recent weakness is not something to ignore, especially as domestic rivals pick up their pace of growth.
Sign up for I/O Fund's free newsletter with gains of up to 221% - Click here
BYD Trumps Tesla in China as Sales Stagnate
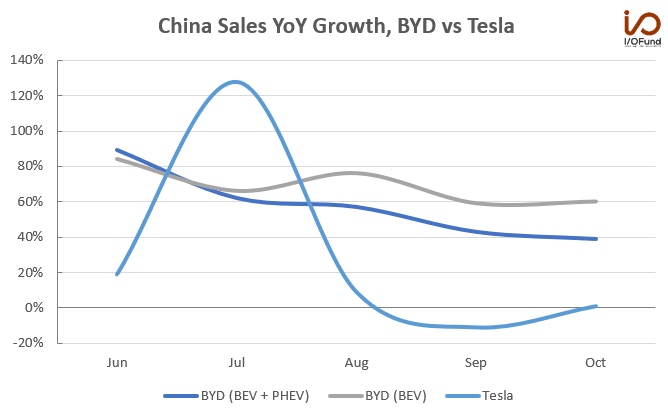
BYD’s delivery numbers have shown tremendous growth in Q3 and the start of Q4, as opposed to Tesla’s stagnation as consumer demand looks to be shifting in favor of local OEMs. XPeng and Li Auto both posted record October numbers with ~300% YoY growth, while NIO saw +60% YoY growth. BYD’s increased dominance in China is more visible with sales data by model: 5 of the top 6 highest selling models in October were BYD, combining for nearly 214,000-unit volume, compared to the Model Y’s 53,249 volume for the month.

Source: I/O Fund
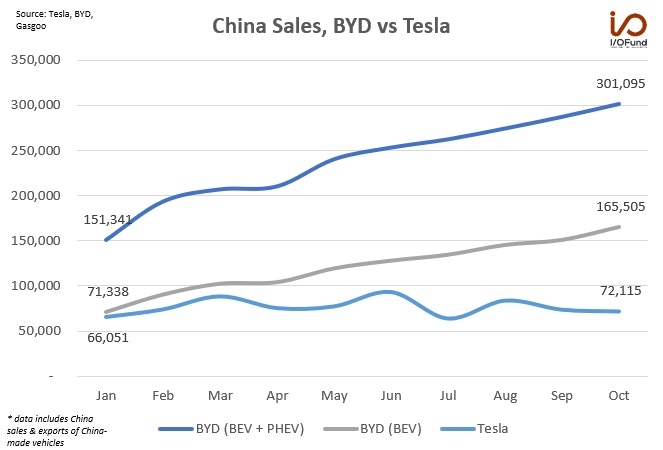
BYD has seen steady growth in NEV and purely BEV sales since May, and since June, BYD has posted five straight record months for NEV deliveries, rising from 253,046 in June to close out Q2 to more than301,000 in October to kick off Q4. Deliveries grew +39% YoY in October, the slowest growth rate so far this year, where monthly sales have averaged +77% YoY growth. In terms of BEV sales, for a more apples-to-apples comparison to Tesla, BYD recorded +60% YoY growth to 165,505 deliveries and exports of China-made vehicles in October – more than double Tesla’s total . At that rate, BYD is set to overtake Tesla in terms of quarterly BEV deliveries, being on track to surpass 500,000 BEVs in Q4, whereas Tesla is forecasting a volume of at least 449,000 vehicles in Q4 to reach its1.8 million target for 2023.

Source: I/O Fund
On the other hand, Tesla’s China sales peaked in June at 93,680 vehicles, with September seeing a nearly (12%) MoM and (11%) YoY decline to 74,073 vehicles, including exports. October saw a fractional YoY increase of just +0.6% while registering a consecutive MoM decline of (2.6%), as the OEM continues to lag the growth of the broader NEV industry.
The Profitability Picture
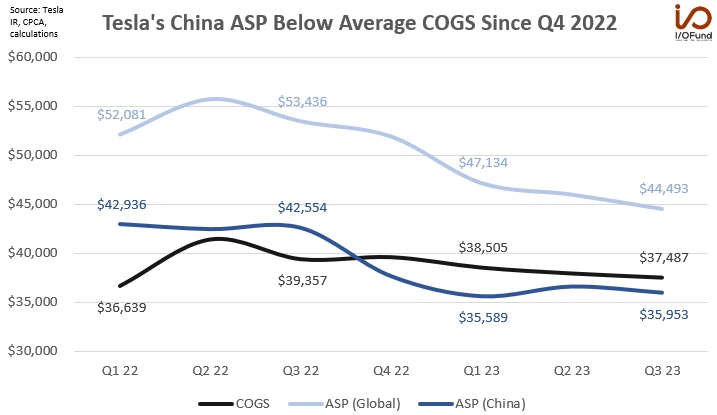
NIO and XPeng are struggling to find a shift to profitability with elevated levels of R&D and losses piling up, whereas Tesla is facing margin troubles, exacerbated by its reliance on China. The reason here is simple: Tesla continues to sell vehicles in China below its average cost, from Q4 2022 through Q3 2023. Currently, the base Model Y is priced around $36,200, and the revamped Model 3 saw a 12% increase in its base price to $35,800 – both still below Tesla’s average cost of ~$37,487 per vehicle in Q3.
The recently announced Model Y price hikes may help alleviate the issue, given the Model Y is accounting for just over 70% of monthly sales in China, but the past four quarters have seen China’s ASP trail average cost per vehicle by (3%) or more.

Source: I/O Fund
- Q1 saw Tesla deliver 137,429 vehicles in China (excluding exports) for an average ASP of $35,589.
- Q2 saw China’s ASP rise ~$1,000 to $36,578 on a +14% QoQ rise in deliveries to 156,676 vehicles. ASP was aided by a price increase in May and a higher mix of Model Y sales.
- Q3 saw ASP decline once more to $35,953, as deliveries slipped (12.2%) QoQ to 139,624
Although Tesla has made progress in bringing its cost per vehicle lower over the past four quarters, ASP has declined at a quicker rate due to extensive price cuts. However, the sheer volume that China contributes – just under 33% of YTD deliveries at 433,729 vehicles – combined with ASP trailing average COGS means that Tesla’s margins will likely not recover above 20% until China’s ASP shifts back above average COGS. It is important for cost of goods sold (COGS) to be below average selling price (ASP), as the difference between the two is the gross profit. In Tesla’s case, China’s ASPs being below average COGS are weighing negatively on gross profit.
We previously discussed how Tesla will likely continue to lower prices to increase its leading EV market share to stave off competition which will intensify over the next few years. In a competitive analysis framework, we projected Tesla’s Q3 operating margins to decline to a level between Honda and VW, or to 7.8% compared to most recent 9.6%. Operating margin for Q3 was 7.6%, just below our base case and above our bearish case model. For a deeper dive into Tesla’s margin story is evolving, read more here and here.

Source: I/O Fund
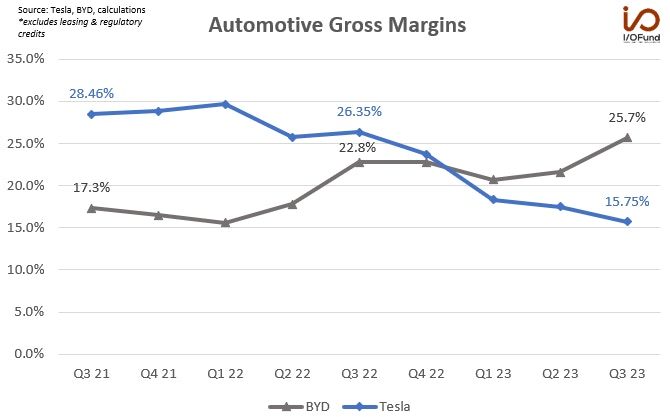
This is increasingly evident when looking at Tesla’s automotive gross margins. Automotive margin saw a pinch in Q2 2022 as COGS rose, before falling below 20% in Q4 2022 as China ASPs shifted below the COGS curve. Margins have fallen each quarter this year as China ASPs remains below the curve, dragging on global ASP which continues to slide as a result of price cuts.
However, BYD is showing strength in margins this year – BYD’s automotive gross margins surpassed 25% in Q3, rising from 20.7% in Q1 and from 22.8% in the year ago quarter. Automotive gross margin has also markedly improved from 15.6% in Q1 2022, an expansion of 1010 bp, while Tesla’s margins have contracted 1390 bp since peaking that same quarter at 29.65%. BYD has cut prices of some of its popular models, but not to the degree that it has become detrimental to margins.
Every Thursday at 4:30 pm Eastern, the I/O Fund team holds a webinar for premium members to discuss how to navigate the broad market, as well as various stock entries and exits. We offer trade alerts plus an automated hedging signal. The I/O Fund team is one of the only audited portfolios available to individual investors. Learn more here.
China’s Importance to Tesla
Tesla’s weaker sales numbers in China in September and October do raise some demand concerns, as these two months typically are the start of seasonal strength lasting through December. It also raises broader concerns within its margins and revenue growth, due to the outsized influence China has on Tesla’s production and deliveries.
Gigafactory Shanghai accounts for slightly more than half of Tesla’s current installed production capacity of ~1.85 million vehicles, with the plant capable of operating at a ~0.95 million annual run rate. Tesla noted in Q3 that the “Shanghai factory has been successfully running near full capacity for several quarters, and we do not expect a meaningful increase in weekly production run rate.” In Q3, Tesla sold 222,517 China-made vehicles, with 82,893 exported. On a YTD basis, Tesla sold 699,056 China-made vehicles, with 265,327 exported. That means China accounted for ~51.1% of Q3’s total deliveries and ~52.1% of the 1.32 million total deliveries YTD.
Shanghai is essentially maxed out in terms of the volume of vehicles that it can churn out, so October’s stagnation raises more questions about how Tesla will regain market share in China. With BYD’s strong growth in Q3 and Tesla’s slide in September, the American EV maker saw its market share fall more than 300 bp QoQ from 12.98% in Q2 to 9.89% in Q3.
While September’s MoM weakness could be chalked up to a production line upgrade in anticipation of the revamped Model 3, October’s MoM stagnation either points to a slowdown in production off full capacity at Giga Shanghai (annualized rate of ~0.86M vs ~0.95M max), or a build-up in China-made inventory. Neither scenario would be much of a positive for Tesla heading into China’s seasonally strong Q4, as both could suggest more demand weakness through the end of the year.
Conclusion
The main story for Tesla investors at the moment is when margins will bottom, as automotive and gross margin continues to deteriorate. China offers a major clue for when and where margins will bottom, given that Tesla relies on the country for about one-third of its deliveries and just over 20% of its revenues.
BYD is excelling at executing during this price-competitive time, with deliveries reaching a new monthly record while margins expand. On the other hand, Tesla has seen monthly sales in China stagnate, with ASP in the country sliding again in Q3. With China’s ASP currently going on five quarters below Tesla’s average COGS, the bottom for margins is still not in sight.
I/O Fund Equity Analyst Damien Robbins contributed to this report.
Please note: The I/O Fund conducts research and draws conclusions for the Fund’s positions. We then share that information with our readers. This is not a guarantee of a stock’s performance. Please consult your personal financial advisor before buying any stock in the companies mentioned in this analysis.
Recommended Reading:


More To Explore
Newsletter

Nvidia, CXL, and the Battle to Improve AI Inference Economics
This is Part 2 of our two-part series on AI inference economics. In Part 1 — Why Nvidia's Next AI Battle Is About Tokens per Watt, we laid out why tokens per watt has become the defining metric for in

Why Nvidia’s Next AI Battle Is About Tokens per Watt
As hyperscalers move from building AI infrastructure to monetizing it, tokens per watt helps to reflect if revenue is scaling and if profitability is improving. Offload engines can increase tokens per

Micron Is Up 900%. Here’s Why the AI Memory Trade May Still Have Room to Run
Over the past 10 months, memory chip stocks have gone from being solid beneficiaries of the AI boom to capturing a massively outsized piece of the return pie. The inflection in Micron’s performance de
Why the S&P 500 Shrugged Off the Iran War — and What Could Finally Break the Rally
On February 28th, the U.S. went to war with Iran, and the market was handed the kind of shock it hasn't contended with for years. The conflict set off a chain reaction across the region: an ongoing su
Nvidia, CoreWeave, and Nebius: Inside the Circular Financing of the GPU Boom
Neoclouds are one of the more hotly debated AI business models, with CoreWeave and Nebius being the two most widely recognized names. These companies have seen their sales, backlog, and share prices s
AMD, Nvidia, Arm, Intel: Inside the $120 Billion CPU Gold Rush
CPUs have gone from an afterthought to becoming the AI trade’s next great bottleneck – and with AMD, Nvidia, Arm and Intel circling a market that is doubling nearly overnight, the only question left i

Google TPU v8 vs Nvidia: How Inference Is Rewriting the AI Market
In April, Google announced it would begin selling its TPUs to select third-party data center operators, which is something the market has anticipated for nearly a decade. The TPU-versus-Nvidia-GPU deb

The AI Networking Stock That Beat Nvidia by 7X YTD for Returns of 135% YTD
AI networking stock Lumentum is among the key I/O Fund winners in 2026. We allocated heavily to LITE in January—a month before Nvidia backed the company. While most investors couldn’t stomach taking a

Bloom Energy — Our 2026 Top Pick Was the Best Performing Stock in April
April was the best month in six years for the Nasdaq-100. The single best-performing large-cap stock wasn't Nvidia, Microsoft, or Meta. It was Bloom Energy, up roughly 109% in one month. As you'll rec

Inside Nvidia’s $4B Optical Strategy—and Why CPO Changes Everything
Within the AI investment theme, there is nowhere that the supply chain shifts faster than in networking, leading companies to gain content on new platforms or lose incremental share. The reason is str
