The Magnificent 7 Are Falling Like Dominos; Only 3 Remain
Written by
Beth Kindig
Lead Tech Analyst
Published: March 5, 2024
Last Updated: March 5, 2024
On this page
This article was originally published onForbes on Feb 29, 2024, 09:34pm EST
The Magnificent 7, defined as Apple, Alphabet, Amazon, Meta, Microsoft, Nvidia and Tesla, have seen a “magnificent” run fueled by AI optimism over the past fourteen months. The Magnificent 7 returned more than 106% in 2023, doubling the Nasdaq 100’s nearly 54% gain and significantly outperforming the S&P 500’s 24% gain. At first glance, it may appear that the Magnificent 7 are continuing their outperformance of the broader indexes in 2024.
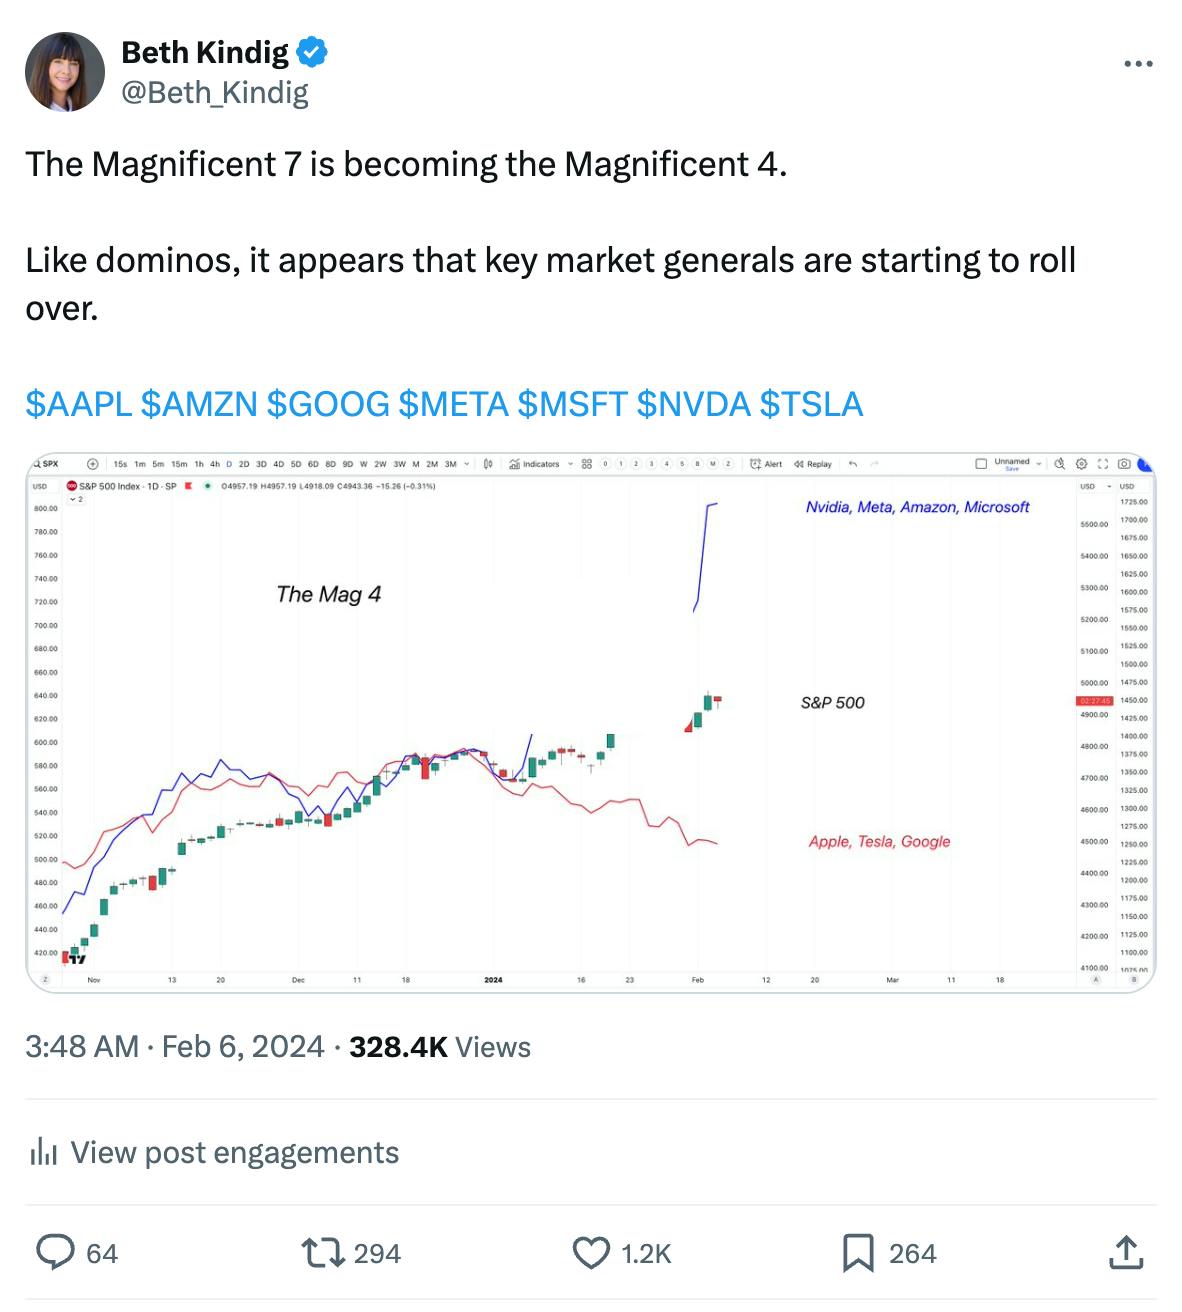
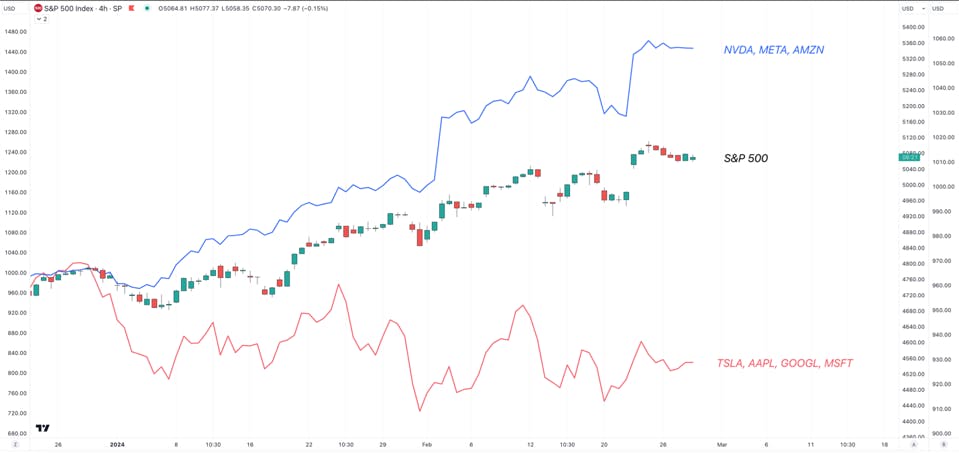
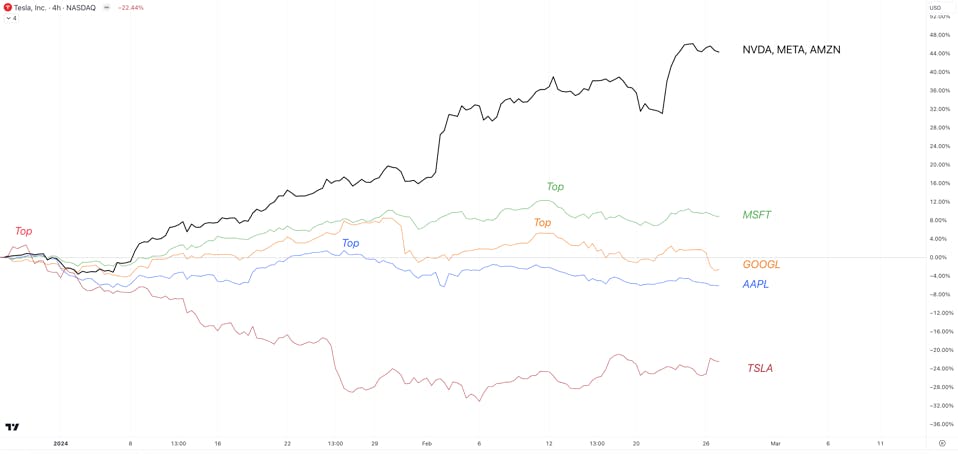
However, like dominos falling, these market generals are topping out and diverging from the broad market. First Tesla in July of 2023, then Apple and Google in February have topped, and now Microsoft is not making a new high with the broad markets’ most recent run higher.
The Magnificent 7 of 2023 have now become 2024’s Magnificent 3: Nvidia, Meta and Amazon. Of these, Nvidia’s saw a stellar start to the year as shares have gained nearly 60% YTD due to the GPU leader’s beat-and-raise quarters.
Source: TradingView
There are two reasons why this matters – which we also outlined in our analysis “Five Stocks (Not Seven) Can Lead to New Highs” from October – that “a handful of these stocks [the Mag 7] can push the bigger markets higher,” but now we’ll need more than just three to keep the rally going.
First, these 7 stocks hold a significant weighting within the indexes. It will be difficult for a sustained push higher to continue if these FAANGs do not participate, considering their outsized weighting.
The Mag 7 comprises more than 40% of the Nasdaq 100 and more than 29% of the S&P 500.
MSFT, GOOGL, AAPL, and TSLA account for about 18% of the S&P 500 and about 25% of the NASDAQ-100.
For reference, just Apple and Microsoft combined hold a larger weighting in the S&P 500 than Berkshire Hathaway, JP Morgan, UnitedHealth Group, Visa, Exxon, Mastercard, Johnson & Johnson, Procter and Gamble, Home Depot, Costco, Merck, and Chevron combined. If these companies collectively all stalled, it would be a major warning sign. Yet, Apple and Microsoft are both stalling.
Sign up for I/O Fund’s free newsletter with gains of up to 221% – Click here
Secondly, when the cycle leaders start to underperform, it tends to mark the start of a trend change. The FAANGs have been the undoubted leaders of this bull run, and we are now seeing them start to trend lower against the indexes. More times than not, the leaders on the way up, tend to be the leaders on the way down.
In today’s bull cycle, this leaves Nvidia, Meta and Amazon as the three remaining generals making new highs with the markets.
Nvidia, Meta and Amazon are the three remaining generals making new highs with the markets. Source: TRADINGVIEW
Combined, the trio account for approximately 15.8% of the Nasdaq 100 and 10.8% of the S&P 500. Nvidia’s post-earnings surge, in which the chip giant added nearly $250B in value, helped the S&P 500 add more than $2 trillion in market cap as it boosted other AI and tech stocks in general. Should the trio begin to follow in the path of the four fallen dominos, setting a high and drifting lower, the market may be at risk of giving up some of its newfound gains, similar to what we had discussed in our analysis “Apple Can’t Save This Tech Rally” at the end of January. In this, we outlined how both the bull and bear cases for the market “are calling for a level of volatility in 2024 that will, at least, retrace the rally we’ve seen since November 2023.”
Concentration Risk Elevated
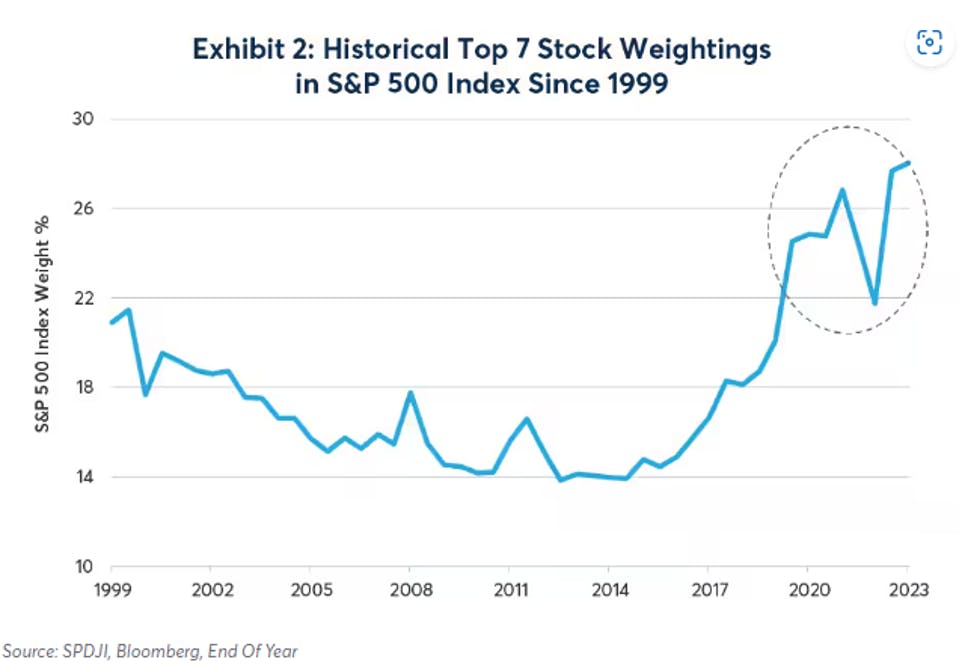
To an extent, the narrow leadership of this market stemming from the Magnificent 7’s AI-powered gains has raised warning bells for some investors, as the market’s concentration has surpassed levels seen in the dot-com bubble. To be clear, my firm is a pioneer in building an AI portfolio, and a selloff would be a buying opportunity. However, narrow leadership is a problem not to be ignored, and this is best illustrated by the chart below:
Source: CME
As mentioned earlier, the Magnificent 7 account for more than 29% of the S&P 500, more than the 21% concentration of the top 7 stocks in the S&P 500 seen in 1999 and 2000 — keep in mind that Tesla is no longer one of the top 10 largest stocks in the S&P 500, so the concentration of the top 7 today is above 30%. This also marks a dramatic increase from the 14% concentration seen a decade ago.
Get Our Free Weekly Stock Newsletter
Get weekly stock insights, market analysis, and technology updates straight to your inbox.
Weekly stock insights
Market analysis
Technology updates
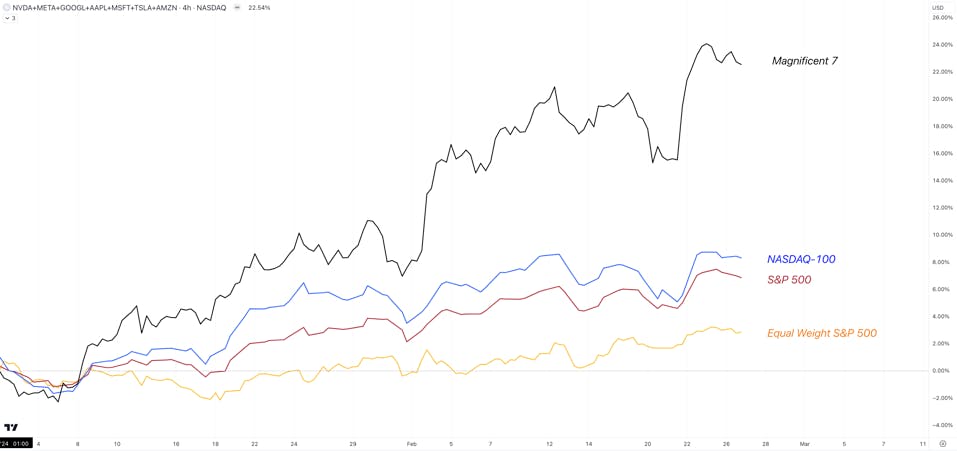
What this means is that as the Magnificent 7 as a whole continue to outperform – the seven have already gained more than 22% YTD in 2024 – they will continue to cover up the turbulence in the broader market that is brewing under the surface. For example, at the end of February, the Nasdaq 100 and S&P 500 are up nearly 9% and over 7%, respectively, while the equal-weighted S&P 500 has gained just over 2%.
Source: TradingView
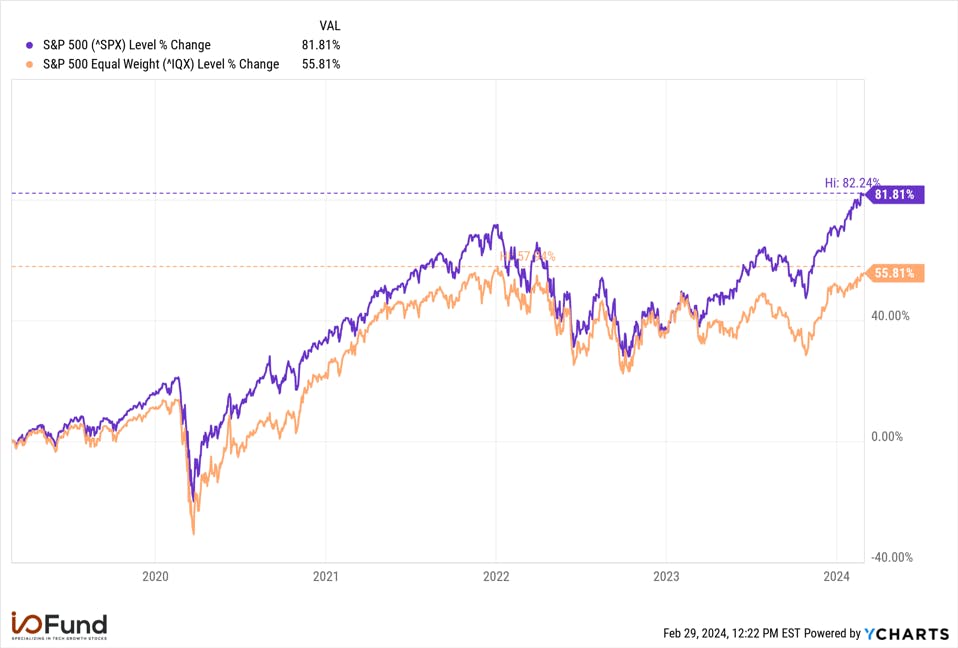
This concentrated dominance has helped the S&P 500 push to new highs, more than 6% above its 2021 high, while the equal weight S&P (orange) has yet to reclaim that 2021 high, sitting about 100 points lower. The influence of the Magnificent 7 is clearly visible — the S&P 500 has a 26 percentage point outperformance of the equal-weight index, returning 81% versus 55% over the past five years; this gap has widened throughout 2023, from 8 percentage points in April to 14 percentage points in July to 20 percentage points in October.
Source: YCharts
I/O Fund Portfolio Manager Knox Ridley outlined in our analysis in October, 5 Stocks (Not 7) Can Lead To New Highs that “a handful of these stocks [the Mag 7] can push the bigger markets higher, and even potentially make another high in the NASDAQ-100.” The setup was that the indices were “due for a sizable bounce over the coming weeks – months, which we believe will be led by a handful of Big Tech names.” Now that we are at new highs, we think we will need more than just three of the Mag 7 to keep going.
Every Thursday at 4:30 pm Eastern, the I/O Fund team holds a webinar for premium members to discuss how to navigate the broad market, as well as various stock entries and exits. We offer trade alerts plus an automated hedging signal. The I/O Fund team is one of the only audited portfolios available to individual investors. Learn more here.
Valuations Relatively Intact
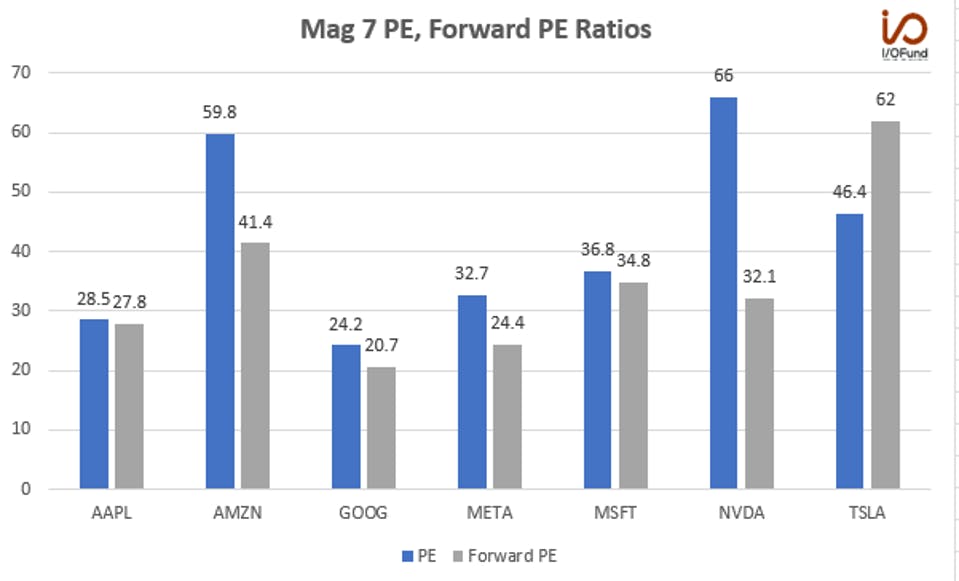
Though the recent momentum-filled surges in AI favorites including Super Micro and Nvidia have some investors drawing parallels to Cisco’s ascent in 2000, valuations for the Magnificent 7 are relatively intact.
Tesla is struggling with earnings growth as price cuts bite margins, while Apple’s growth headwinds are leading to minimal earnings growth; on the other hand, Amazon is showing strong earnings leverage from improvements in its margins, Google is trading at a near 30% discount to its year-ago PE of 30x, and Nvidia is eerily cheaper now than it was when it had bottomed in October 2022 in the low $100 range.
Source: YCharts
Compare this to Cisco, given the parallels being drawn, which traded at more than 150 times earnings at the peak of the dot-com bubble – or more than twice as high a multiple as the most expensive of the Mag 7 of today.
We discussed on Fox Business News this week that keeping an eye on valuation is important for determining which stocks to buy on dips. The impact AI has had is very visible on the top line with blowout quarters from Nvidia, and on the bottom line with blowout quarters from both Nvidia and Meta. However, AI’s impact on valuations is being overlooked as these valuations are low and setting up a new buying opportunity should the broad market present weakness.
Conclusion
We will continue to track how the Magnificent 3 perform over the next few weeks, and whether Meta, Nvidia, and Amazon will continue to lead or if they will follow the trend of the remaining four in underperforming versus the broader indices.
When these cycle leaders start underperforming, it usually marks the start of a trend change. The FAANGs undoubtedly have led this bull run since 2023. We are now looking for what will lead the market next, and most importantly, when.
If you own AI stocks or are looking to own AI stocks, consider joining us for our next broad market webinar. Every Thursday at 4:30 pm Eastern, the I/O Fund team holds a webinar for premium members to discuss how to navigate the broad market, manage risk, as well as revealing our various long-term game plans regarding stock entries and exits. We offer trade alerts plus an automated hedging signal. The I/O Fund team is one of the only audited portfolios available to individual investors. Learn more here.
I/O Fund Portfolio Manager Knox Ridley and I/O Fund Equity Analyst Damien Robbins contributed to this report.
Please note: The I/O Fund conducts research and draws conclusions for the Fund’s positions. We then share that information with our readers. This is not a guarantee of a stock’s performance. Please consult your personal financial advisor before buying any stock in the companies mentioned in this analysis.
Beth Kindig is the lead tech analyst for the I/O Fund with audited results that beat Ark in 2020 and returns of up to 1700% on her premium site in two years and 1150% in her free newsletter in three years on individual stocks and assets.