Five Stocks (Not Seven) Can Lead to New Highs
October 27, 2023

Knox Ridley
Portfolio Manager
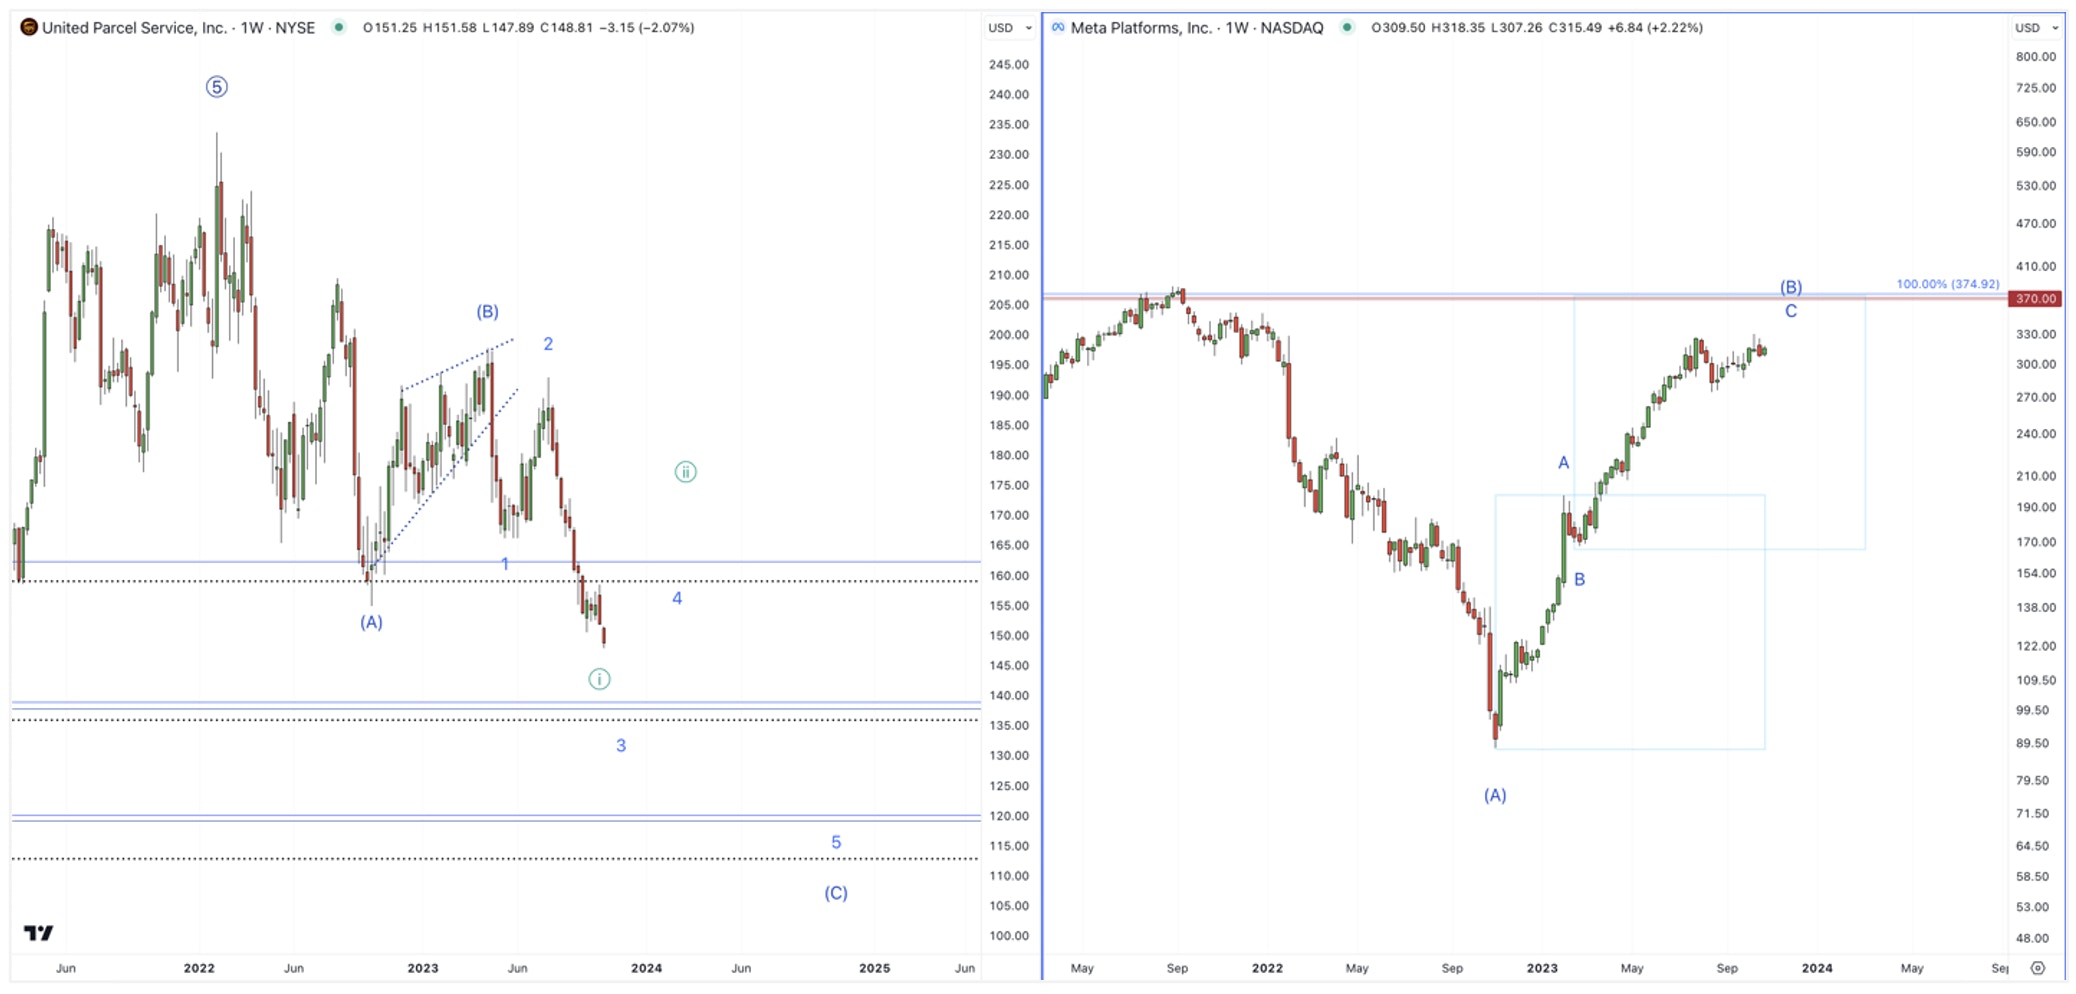
This is a complicated market, and there is really no better image to prove this point than comparing the transportation juggernaut, UPS, to the big tech juggernaut, META. While UPS has broken below its October 2022 lows and is currently in free fall, META’s uptrend is incomplete, and needs one more push higher to at least the $370 level before completing.

The majority of other sectors are confirming a continuation of the 2022 bear market, meanwhile, a handful of big tech names, with outsized weighting in the major indexes, suggest that they want to go higher. Though this pattern of narrow leadership where the market is held up by 7 stocks is unsustainable and a warning of an unhealthy market, it can continue, and likely will, at least into late 2023/early 2024.
With markets continuing a nearly 3-month correction, the consensus is now confirming what we have been saying since July.
“We do not believe a recession is priced into equities, and that it is inevitable. However, this doesn’t mean that we can’t see higher levels from here, before a recession hits.”
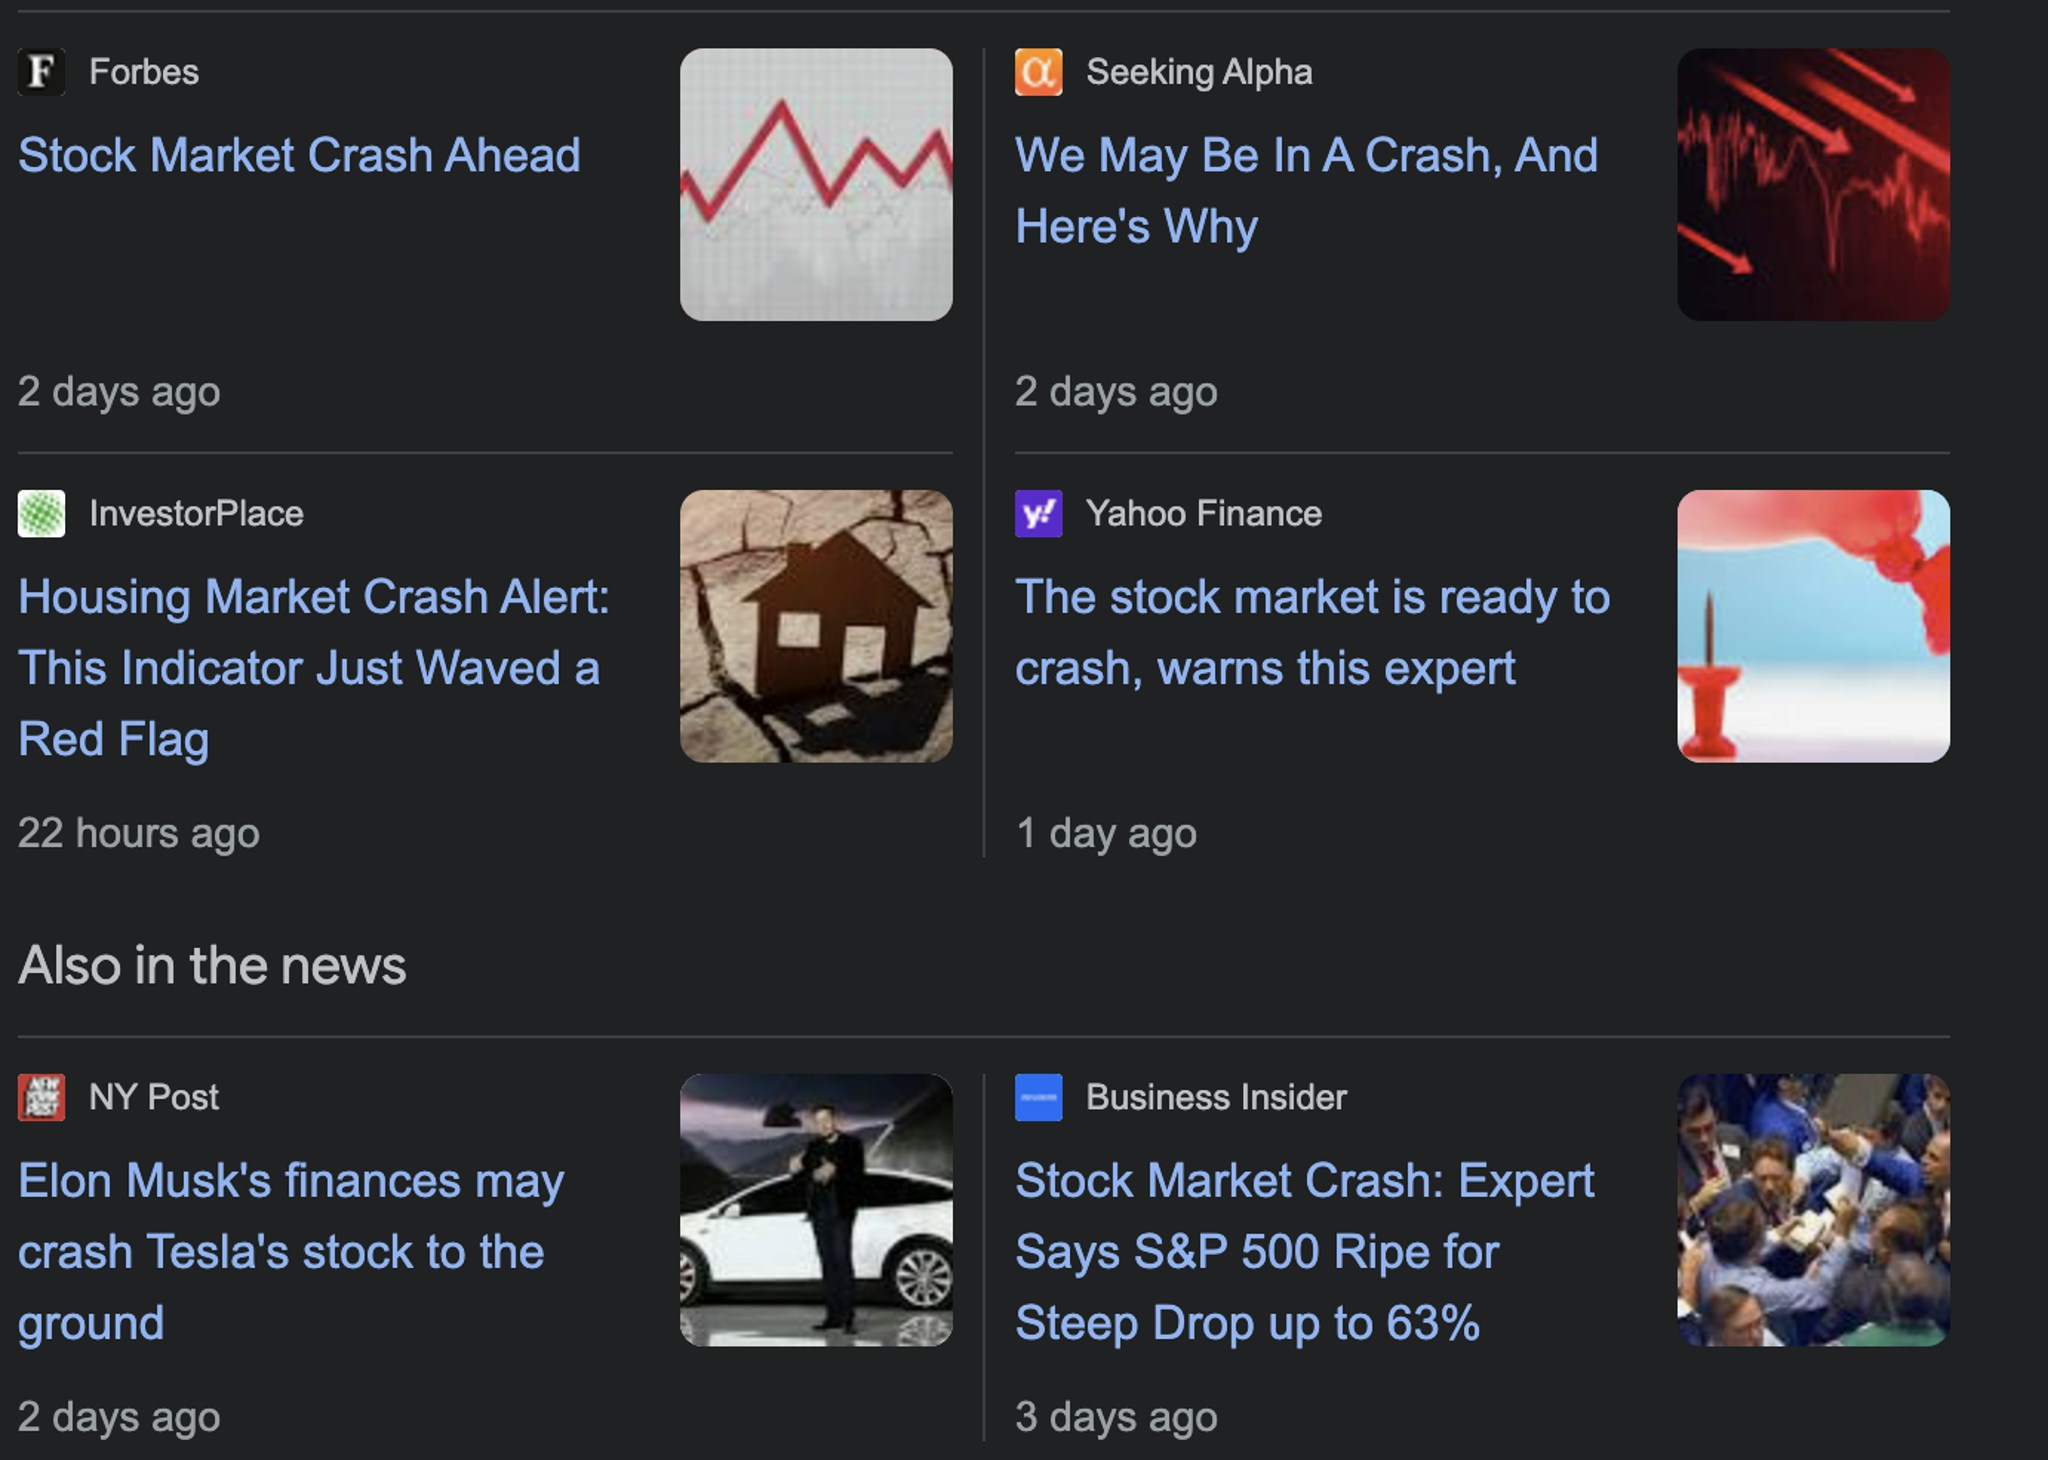
In other words, bearish sentiment is now accompanied with the mainstream news is calling for an imminent market crash. This is after flooding the market with non-stop narratives about a soft landing.

However, unlike the consensus, we believe this final swing higher in the markets has one more run in it before the secular bear market that started in 2022 commences again.
Five Stocks (Not Seven) Can Lead to New Highs
Nasdaq had the best first 6 months in the index’s history, and this rally was propped up by seven stocks known as the Magnificent 7: Apple, Amazon, Meta, Tesla, Nvidia, Microsoft and Alphabet. Meanwhile, the rest of the market is struggling. Many argue otherwise, but the picture below is worth a thousand words in terms of illustrating the narrow leadership of this market.

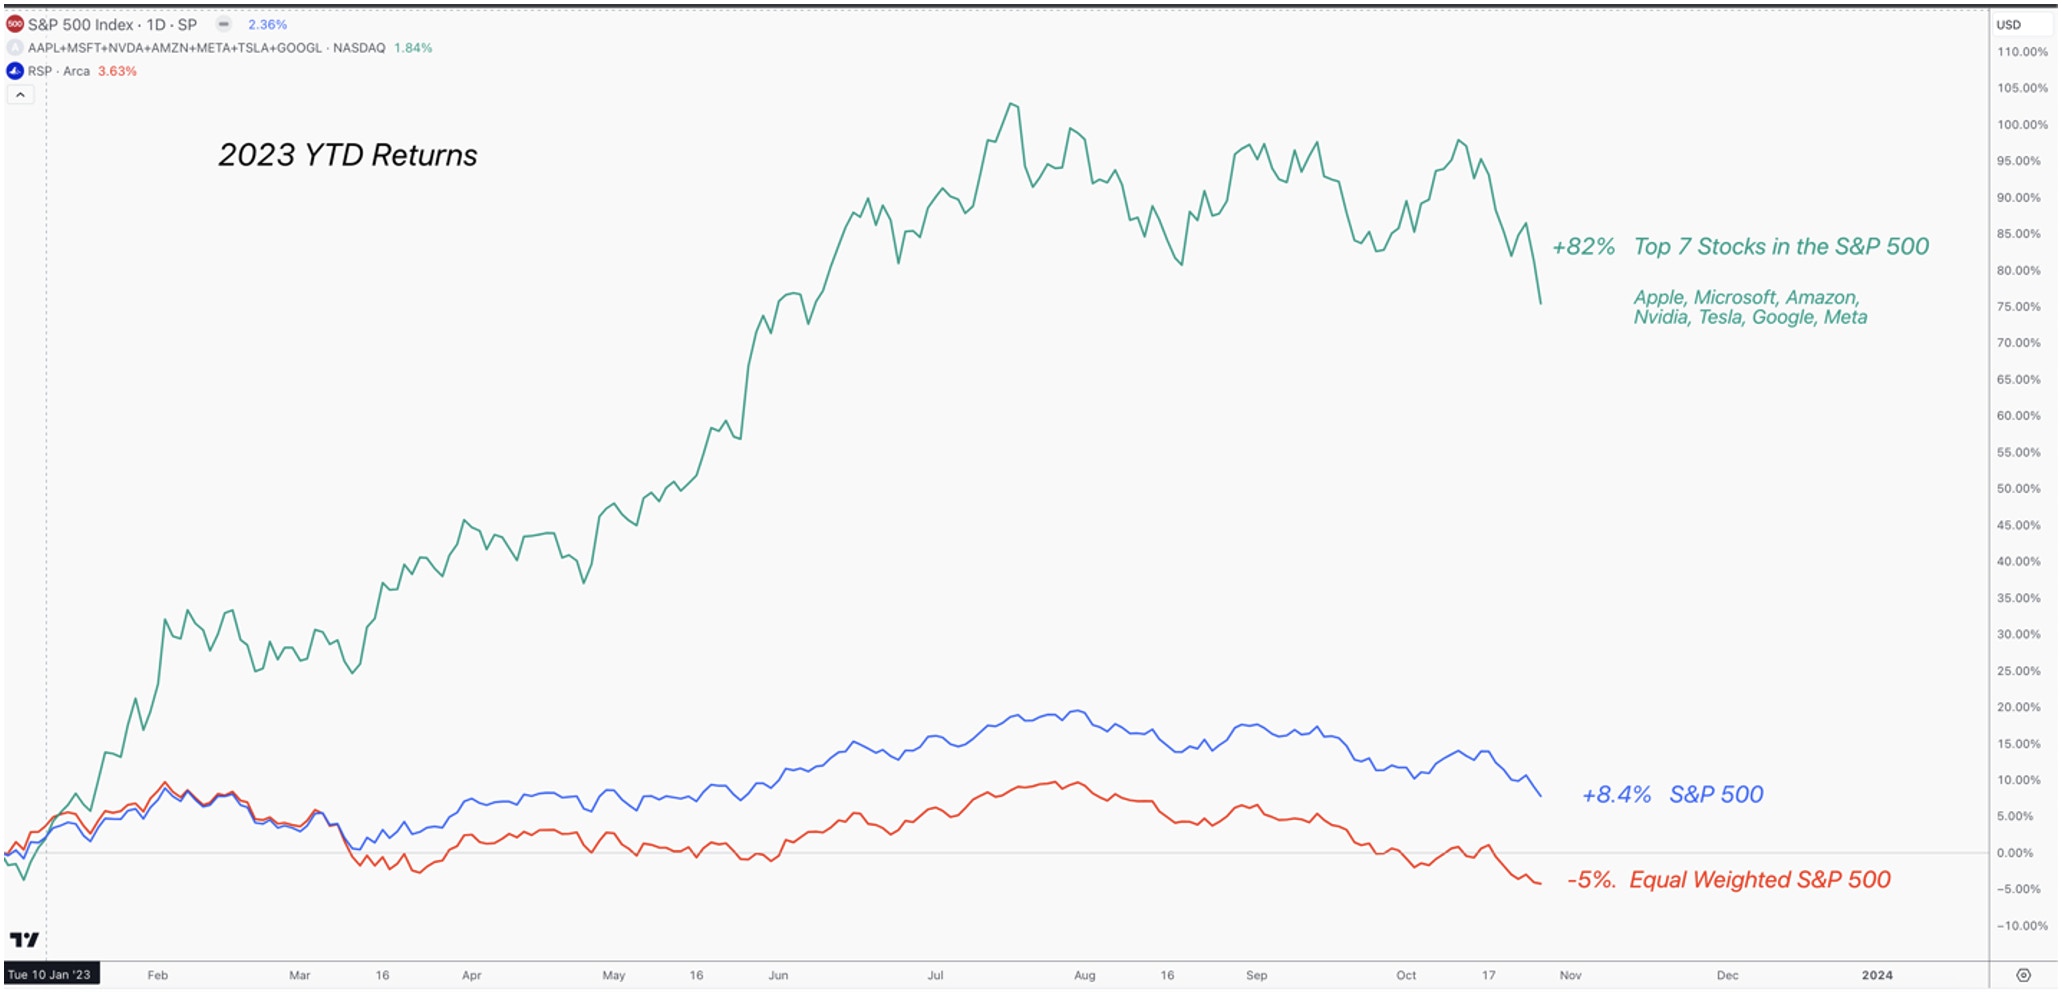
What is most concerning is that the equal weighted S&P 500 (RSP), which gives the same weighting to all 500 stocks in the index, is actually negative for the year. This matters because in a healthy economy, all sectors tend to participate, while mid-caps tend to outperform large caps. So, when the equal weighted S&P 500 is outperforming on a relative basis, it tends to be a good sign for the foundation of a new bull market.
The Equal Weighted S&P 500, like many others indexes, has put in a large top, and will likely not see a new all-time high for a long time. Note in the below chart that RSP could not sustain above its February highs, and has now broken through the major trendline in a 5-wave pattern.

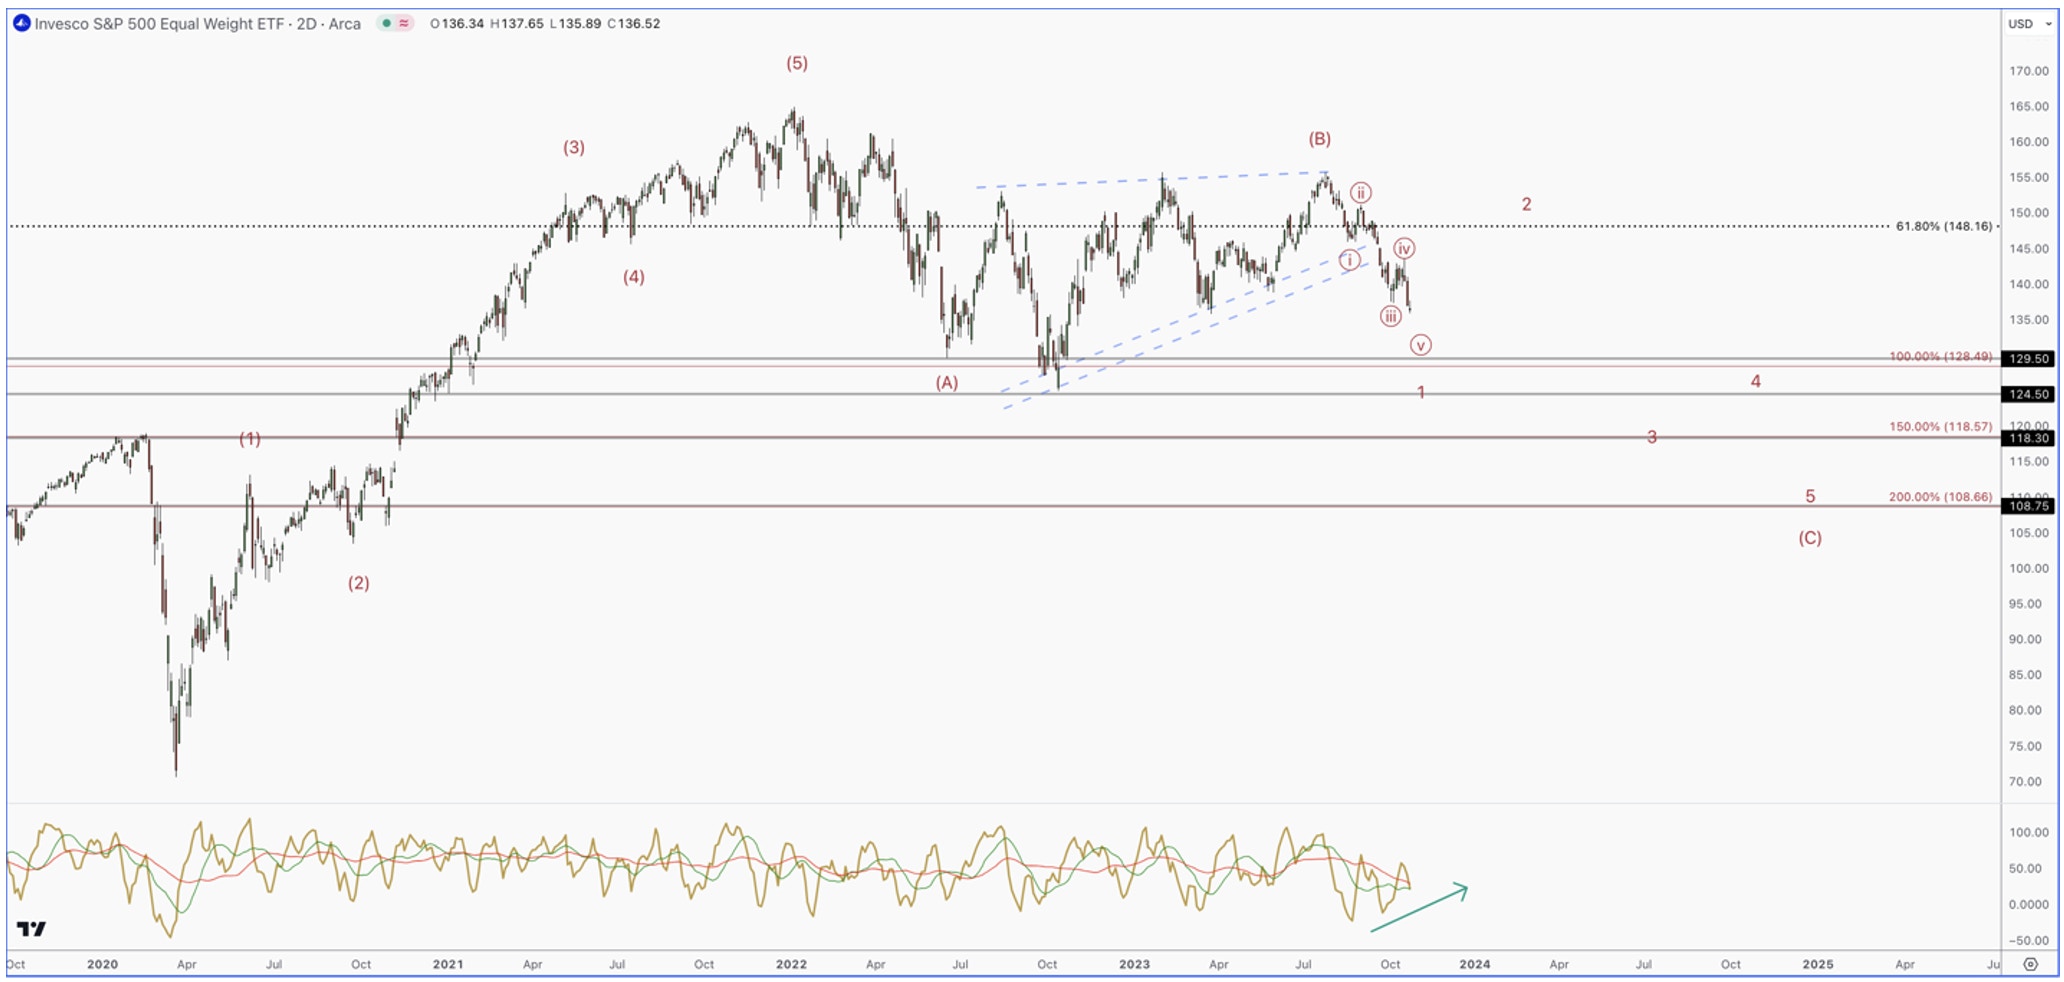
If the market is going to continue the bear market that started in 2022 to new lows, it will have to take the form of a 5-wave pattern pointing down. These patterns are fractal, which means that a small one builds into a larger one until we reach our target. So, the fact that the current drop in RSP is taking the shape of a 5-wave pattern is quite concerning, and also confirms that we are likely still in a larger bear market.
However, markets do not drop in straight lines. The current 5-wave pattern is only the first wave (of 5) that should take us much lower. What follows this pattern is always a 3 wave retrace that makes a lower high. So, even though sentiment is prepping for a crash, we still have one more bounce before that happens.
Even with this weakness we are seeing throughout the market, the magnificent 7 stocks account for ~28% of the S&P 500’s total weighting, and nearly ~42% of the NASDAQ-100. It is feasible that even with the broad level of weakness we are seeing, a handful of these stocks can push the bigger markets higher, and even potentially make another high in the NASDAQ-100.
The Macro Backdrop
In late August, we stated that..
“According to the economic trends we are seeing, there is simply no evidence of a recession brewing in Q3 of this year, and this is important for investors to realize this when looking for some type of top.”
This remains true today, as the resilience of the US economy is still chugging along.

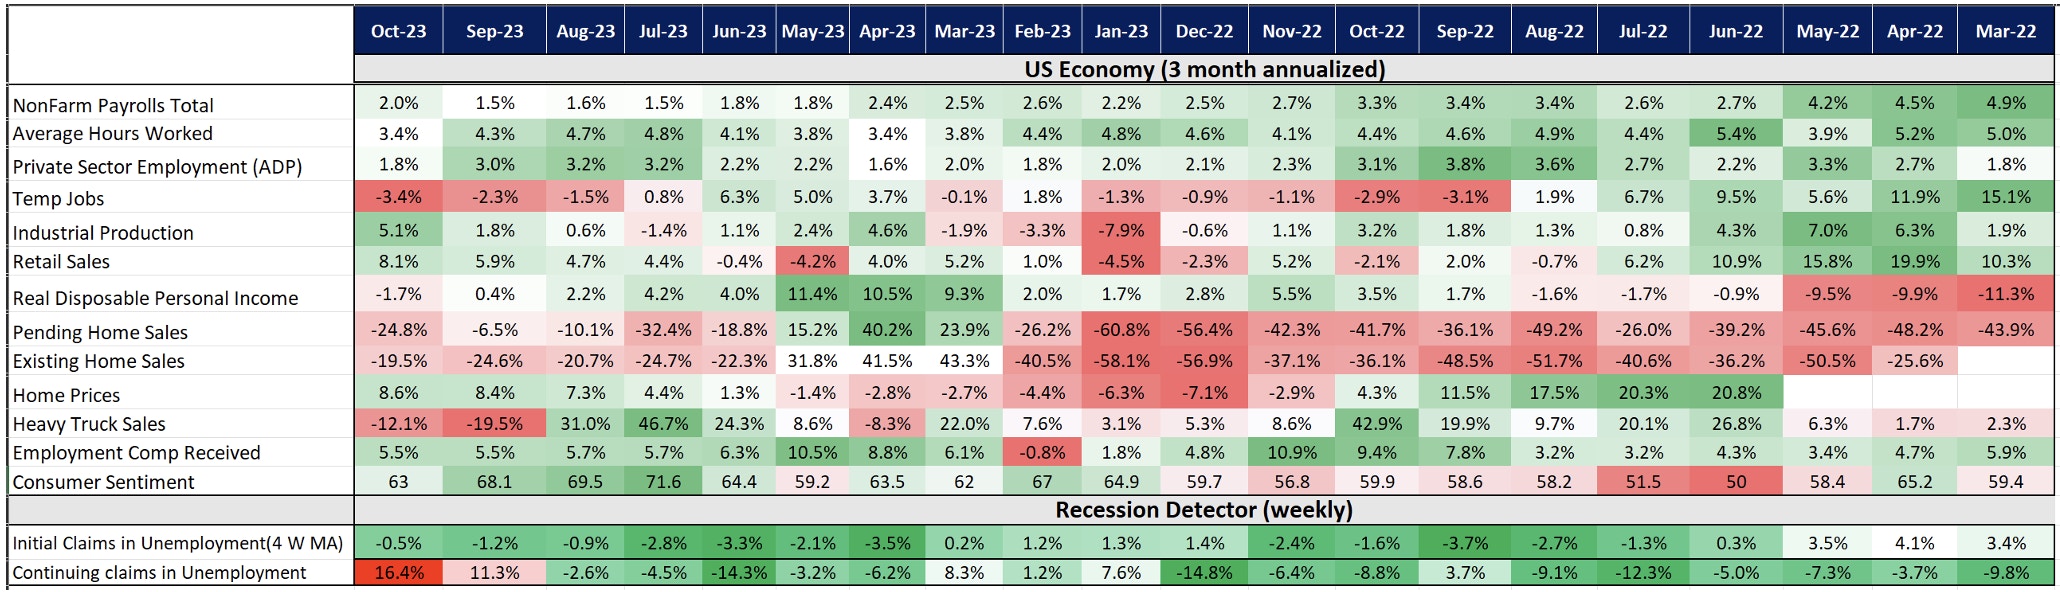
Not only has retail sales accelerated for the 6th month in a row, but industrial production gave us the strongest 3-month annualized reading since May of 2022. Most importantly, employment is still quite strong. Once we see a sharp rise in the 4 week average for initial jobless claims, we can start to looking for an imminent recession. Until then, we simply see no sign that the economy is heading into a recession right now.
Furthermore, we warned our readers to be cautious of claiming victory over inflation in June of 2023.
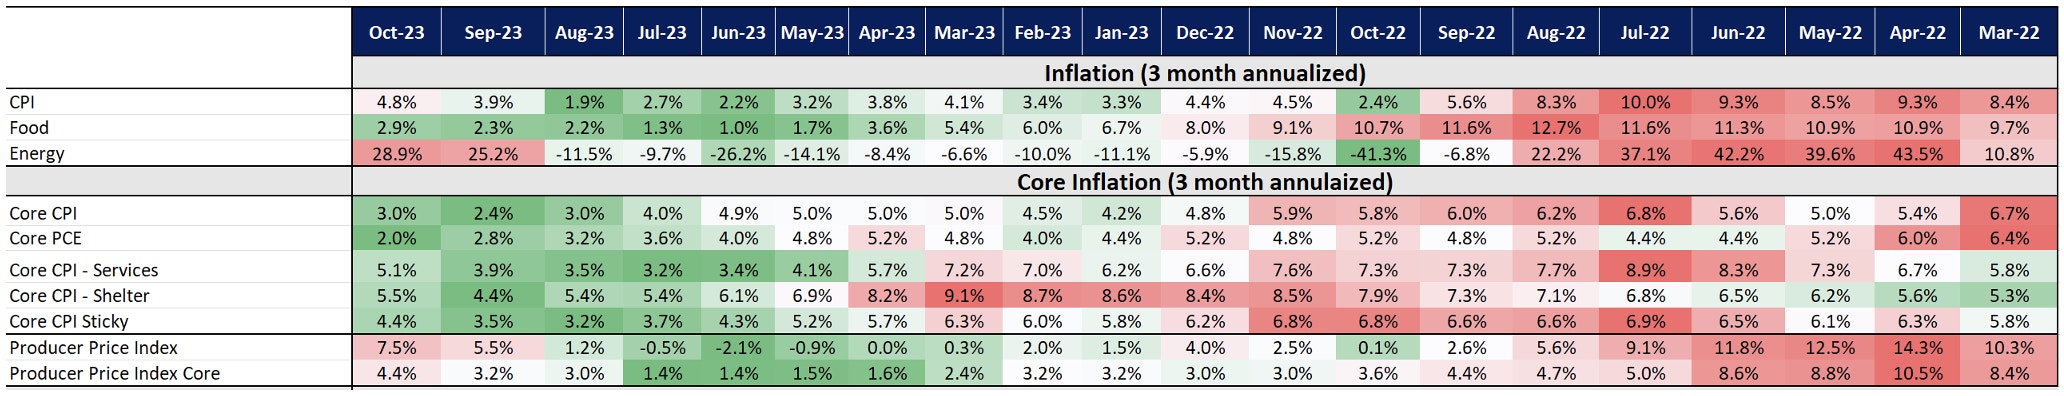
“Peak inflation is behind us, but the real battle will be getting these numbers back to the 2% target. In fact, going back in history, there is no instance where core PCE inflation backs off from an inflation impulse without a recession.”
This has proven to be true, as we have seen 2 months in a row of reacceleration in CPI numbers. Most importantly, these numbers have bottomed well above the FED’s 2% targets on a YoY basis. In the below chart, core inflation has remained well above the Fed’s target, while the incredible disinflation that we saw in the Spring/Summer was due to decelerating energy prices.

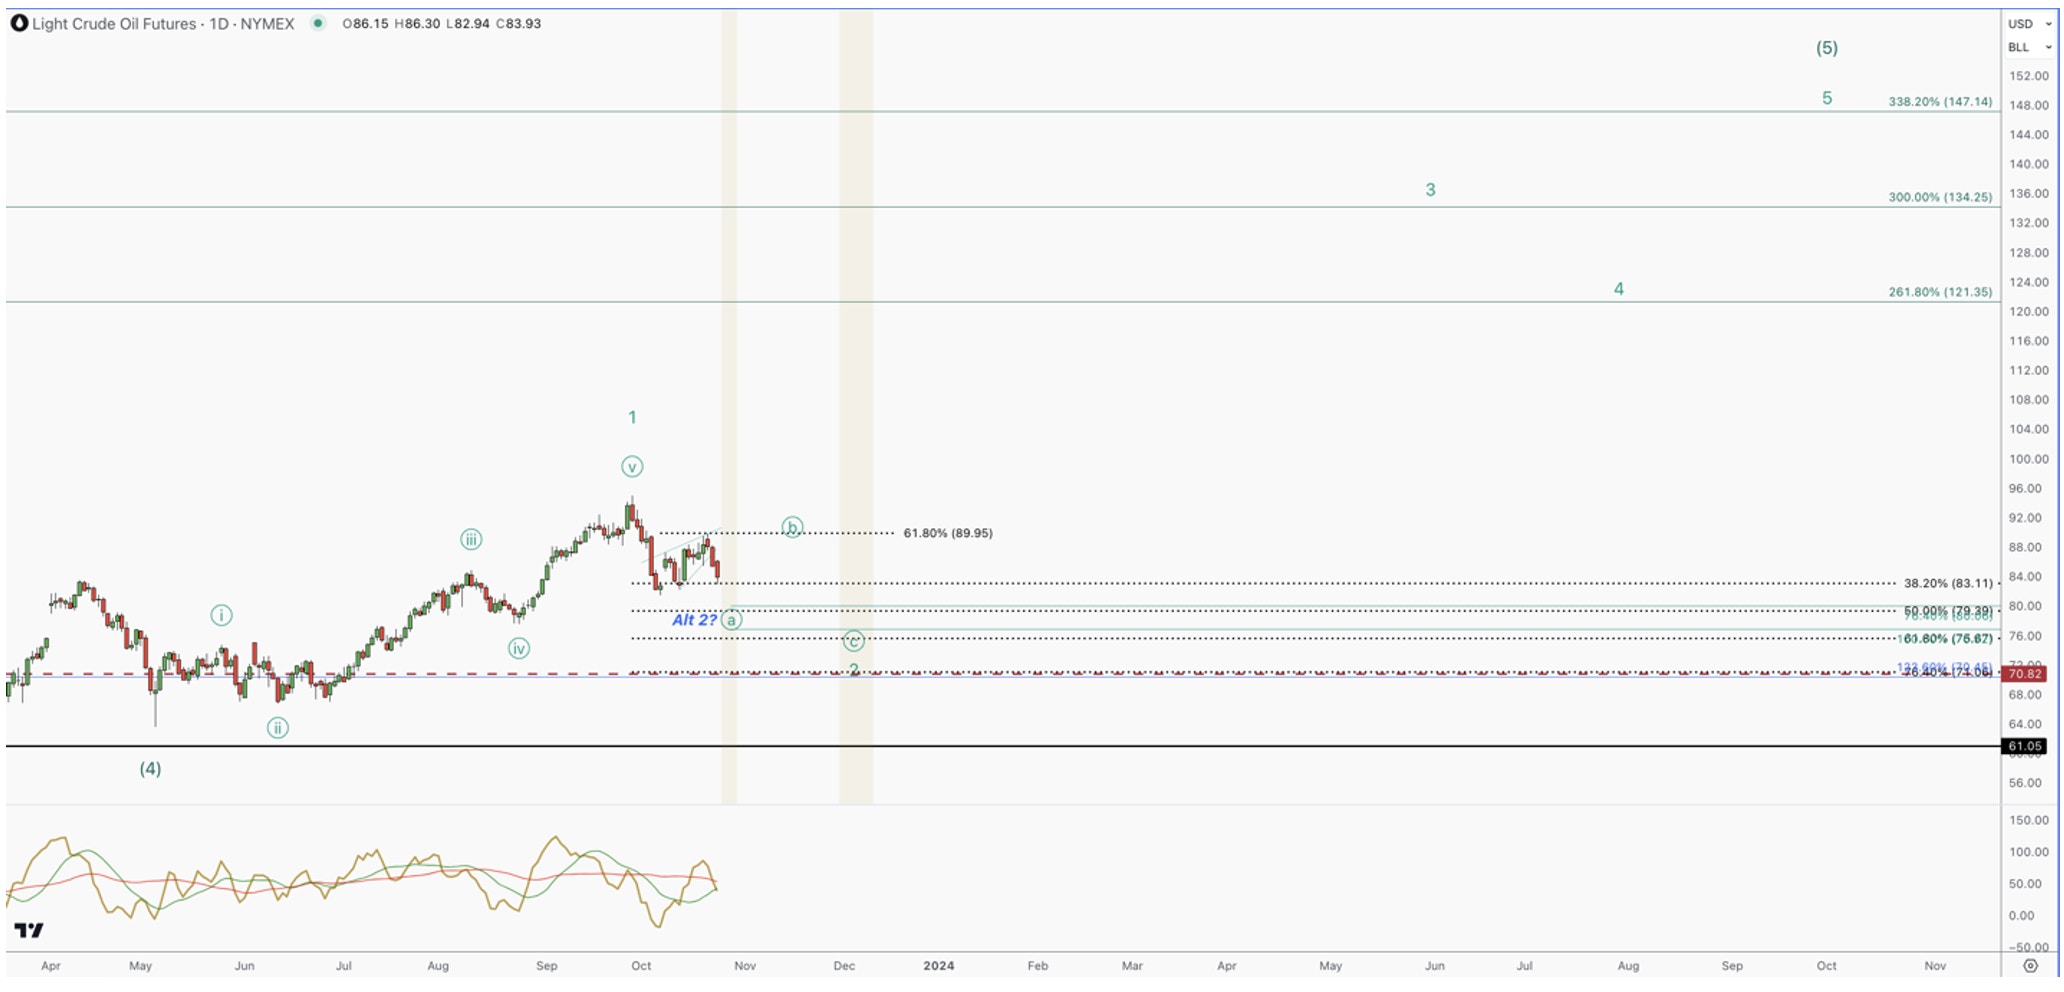
It has been our view that energy prices would make a run back to the highs in the coming months, and this new uptrend has further confirmed this thesis. However, as stated prior, markets do not move in a straight line. Now that we have a completed a full 5-wave move off the low in crude oil, which would be the 1st wave, we are now seeing the 2nd wave pullback.
Sign up for I/O Fund's free newsletter with gains of up to 221% - Click here
The most likely path is the count presented in green. We are seeing the end of the first leg in a 3 leg correction. This could take us as low as $76/barrel and could last through November/December. If this plays out, this will relieve pressure from the coming CPI prints, and allow equities to make the next leg higher.

This is further confirmed when we look at the Japanese Nikkei, which has a strange history of leading the NASDAQ. Japan must import all of their oil. So, if oil is moving higher, companies within the Nikkei will see contracting margins, which is not good for stocks. When we look at the Nikkei, much like many of the magnificent 7, it has an incomplete uptrend.

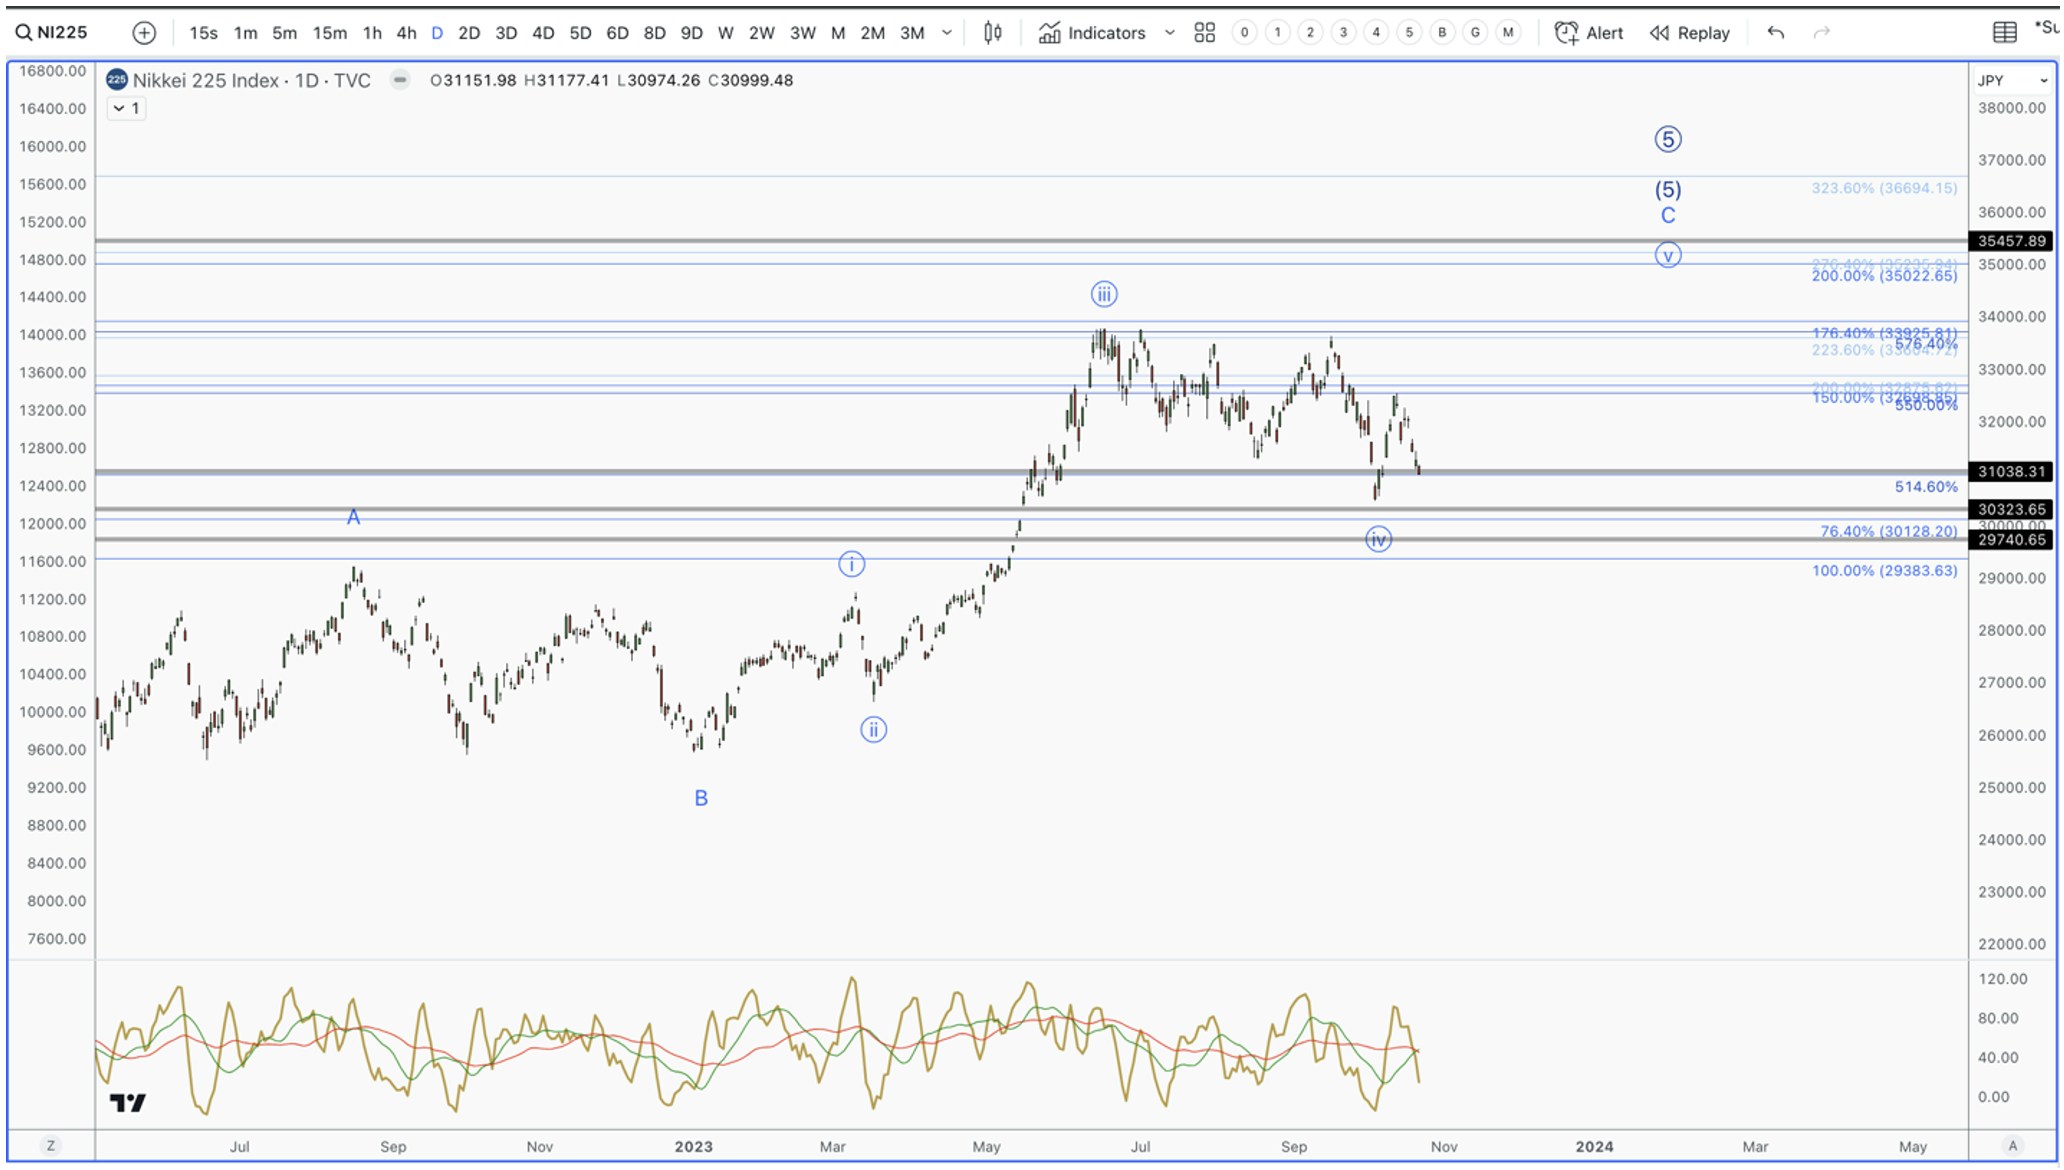
Note how the correction, so far, has been an overlapping mess of a pattern. This is very common in 4th waves. It also implies that a 5th wave rally is needed to complete the larger pattern. If Japan is going higher, oil is going lower, which should propel equities in the US through the end of the year.
What This Means for S&P 500
In mid-September we laid out 3 potential paths that this bull market would to into a major top. From our assessment, the odds of a recession were very low in Q3, which was proven correct. Because of this, if the July high was the actual top, then it would likely be an event that pulls forward the recession.
Our line in the sand was 4245 SPX, which we breached and have continued lower. Because of this, we have narrowed the potential paths to two, and are leaning into our top-is-in count, in red.

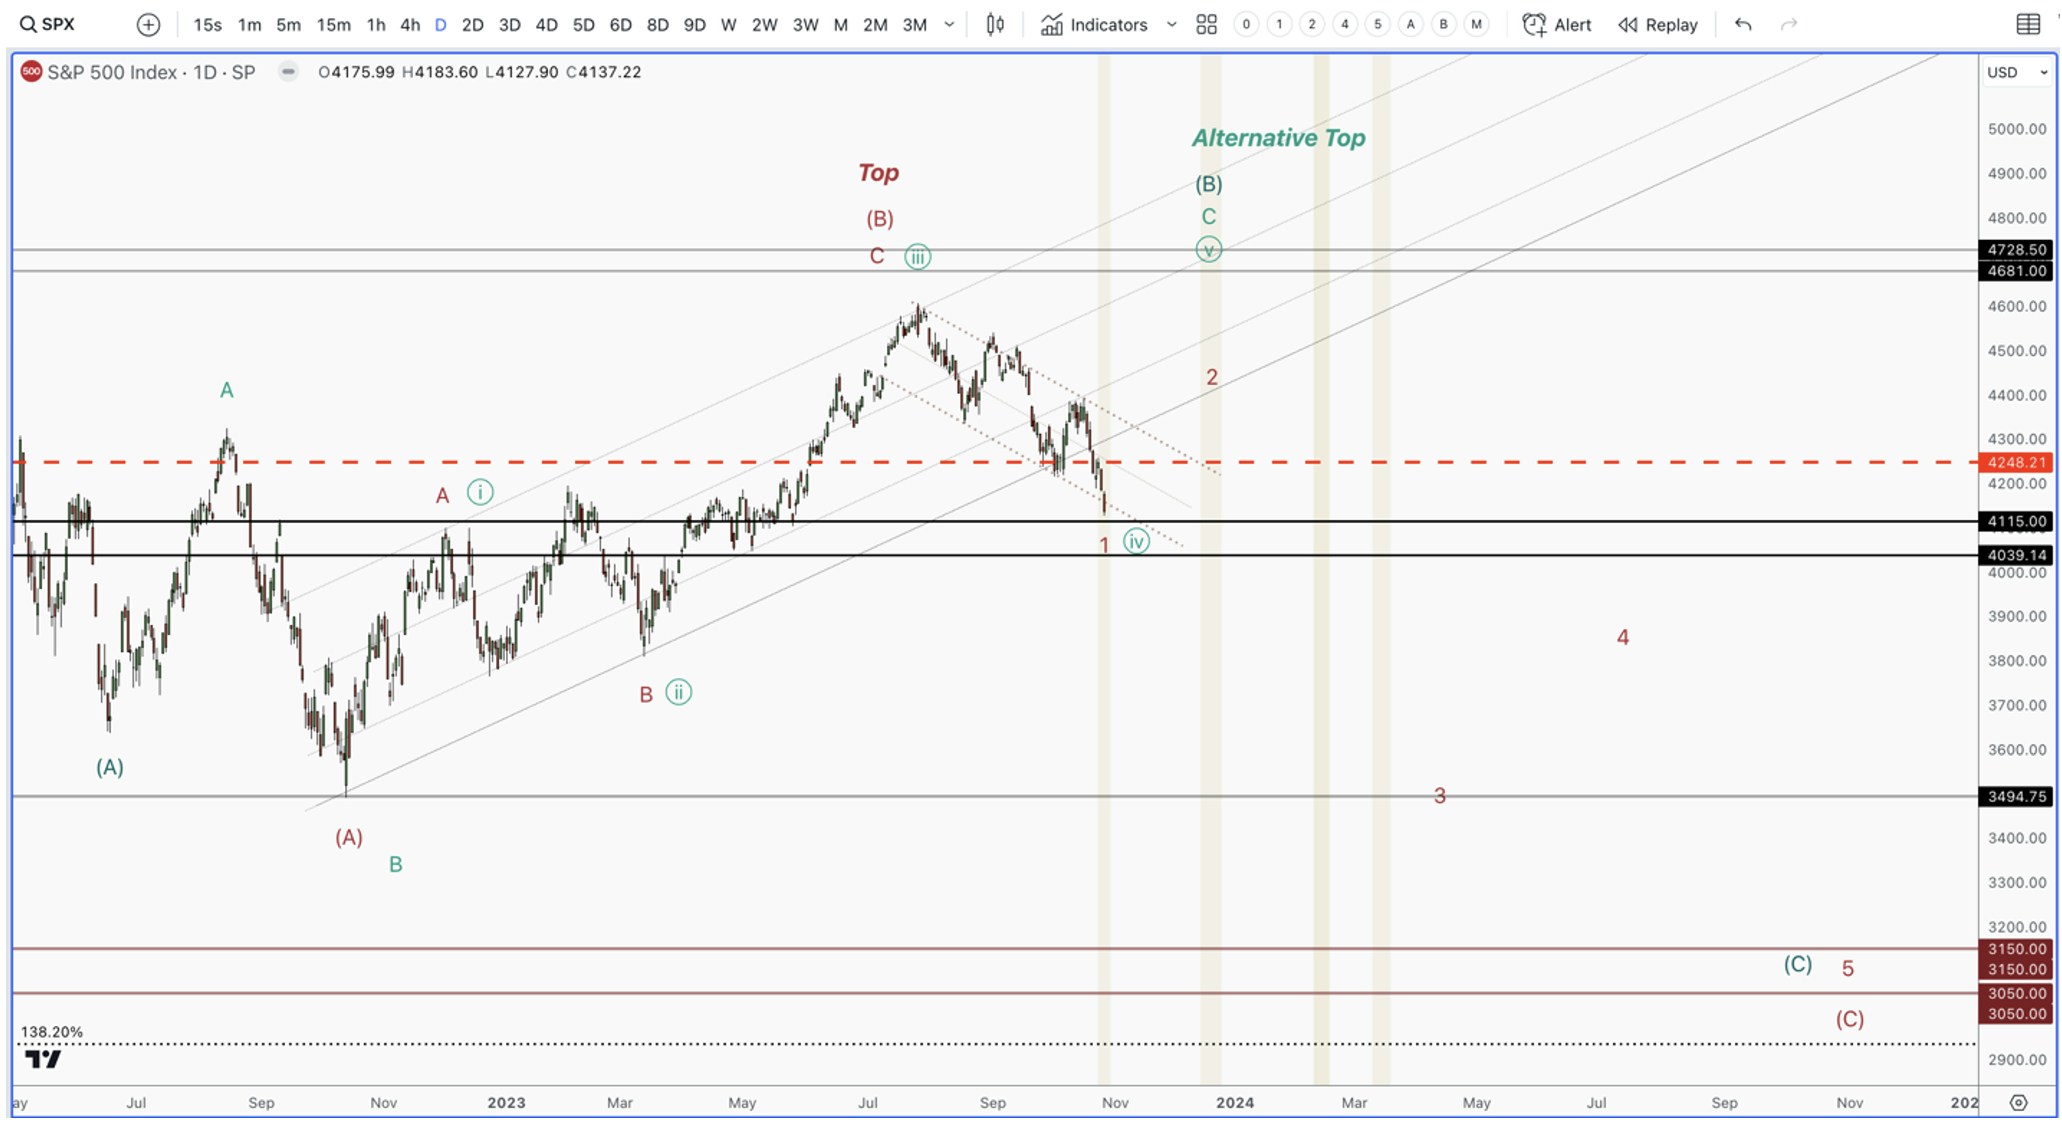
This drop in the S&P 500 has gone too low, and lowered the odds of us making a new high. However, at minimum, we are due for a sizable bounce over the coming weeks – months, which we believe will be led by a handful of Big Tech names.
My green count above sees the S&P 500 making one more high, which is not completely off the table. In order for this to happen, we would need to see Microsoft and Apple both present solid reports, and start new uptrends. A lot rides on how the market reacts to Apple’s report. We would also need to see Amazon, Meta, and Nvidia participate, all of which have charts that can allow for one more high. So, it’s not improbable to see the above green count play out with only a handful of stocks leading.
These scenarios are what we are game planning for, while also keeping a cautious eye on the bigger picture – we are likely setting up for a return of the bear market sooner than most think. For this reason we have been quite defensive for most of the year. If we instead see a vertical drop from these levels that takes us below 4000 SPX, we will drop the thesis that we are setting up for a bounce, and assume that we are the central part of this drop.
In conclusion, we have been adamant that we are in a cyclical bull market within a secular bear market. The macro environment as well as weakness outside of the magnificent 7 has only continued to prove this thesis. However, in this environment, we only need 5 stocks to keep the market moving higher. With no recession in sight, and oil relieving inflation fears, the market is setting up for a move higher in the coming weeks/months. Regardless, if we make a new high or a lower high, the next sizable bounce we will use to further de-risk our portfolio
Recommended Reading:


More To Explore
Newsletter

Micron Is Up 900%. Here’s Why the AI Memory Trade May Still Have Room to Run
Over the past 10 months, memory chip stocks have gone from being solid beneficiaries of the AI boom to capturing a massively outsized piece of the return pie. The inflection in Micron’s performance de

Why the S&P 500 Shrugged Off the Iran War — and What Could Finally Break the Rally
On February 28th, the U.S. went to war with Iran, and the market was handed the kind of shock it hasn't contended with for years. The conflict set off a chain reaction across the region: an ongoing su

Nvidia, CoreWeave, and Nebius: Inside the Circular Financing of the GPU Boom
Neoclouds are one of the more hotly debated AI business models, with CoreWeave and Nebius being the two most widely recognized names. These companies have seen their sales, backlog, and share prices s
AMD, Nvidia, Arm, Intel: Inside the $120 Billion CPU Gold Rush
CPUs have gone from an afterthought to becoming the AI trade’s next great bottleneck – and with AMD, Nvidia, Arm and Intel circling a market that is doubling nearly overnight, the only question left i
Google TPU v8 vs Nvidia: How Inference Is Rewriting the AI Market
In April, Google announced it would begin selling its TPUs to select third-party data center operators, which is something the market has anticipated for nearly a decade. The TPU-versus-Nvidia-GPU deb
The AI Networking Stock That Beat Nvidia by 7X YTD for Returns of 135% YTD
AI networking stock Lumentum is among the key I/O Fund winners in 2026. We allocated heavily to LITE in January—a month before Nvidia backed the company. While most investors couldn’t stomach taking a

Bloom Energy — Our 2026 Top Pick Was the Best Performing Stock in April
April was the best month in six years for the Nasdaq-100. The single best-performing large-cap stock wasn't Nvidia, Microsoft, or Meta. It was Bloom Energy, up roughly 109% in one month. As you'll rec

Inside Nvidia’s $4B Optical Strategy—and Why CPO Changes Everything
Within the AI investment theme, there is nowhere that the supply chain shifts faster than in networking, leading companies to gain content on new platforms or lose incremental share. The reason is str

Is Nvidia Stock a Buy? Why Semiconductor Strength May Signal a Market Top
In this report, we take a deeper look at the technical scenarios, which suggests that Nvidia’s latest high is shaping up to be a potential bull trap. That view is corroborated by the broader semicondu

Nvidia’s $20 Trillion Thesis Is Intact. My 2026 Allocation Isn't
The thesis on Nvidia's hardware moat has played out exceptionally well, but that also highlights one of the biggest risks investors face, which is becoming emotionally attached to a winning stock. Whi
