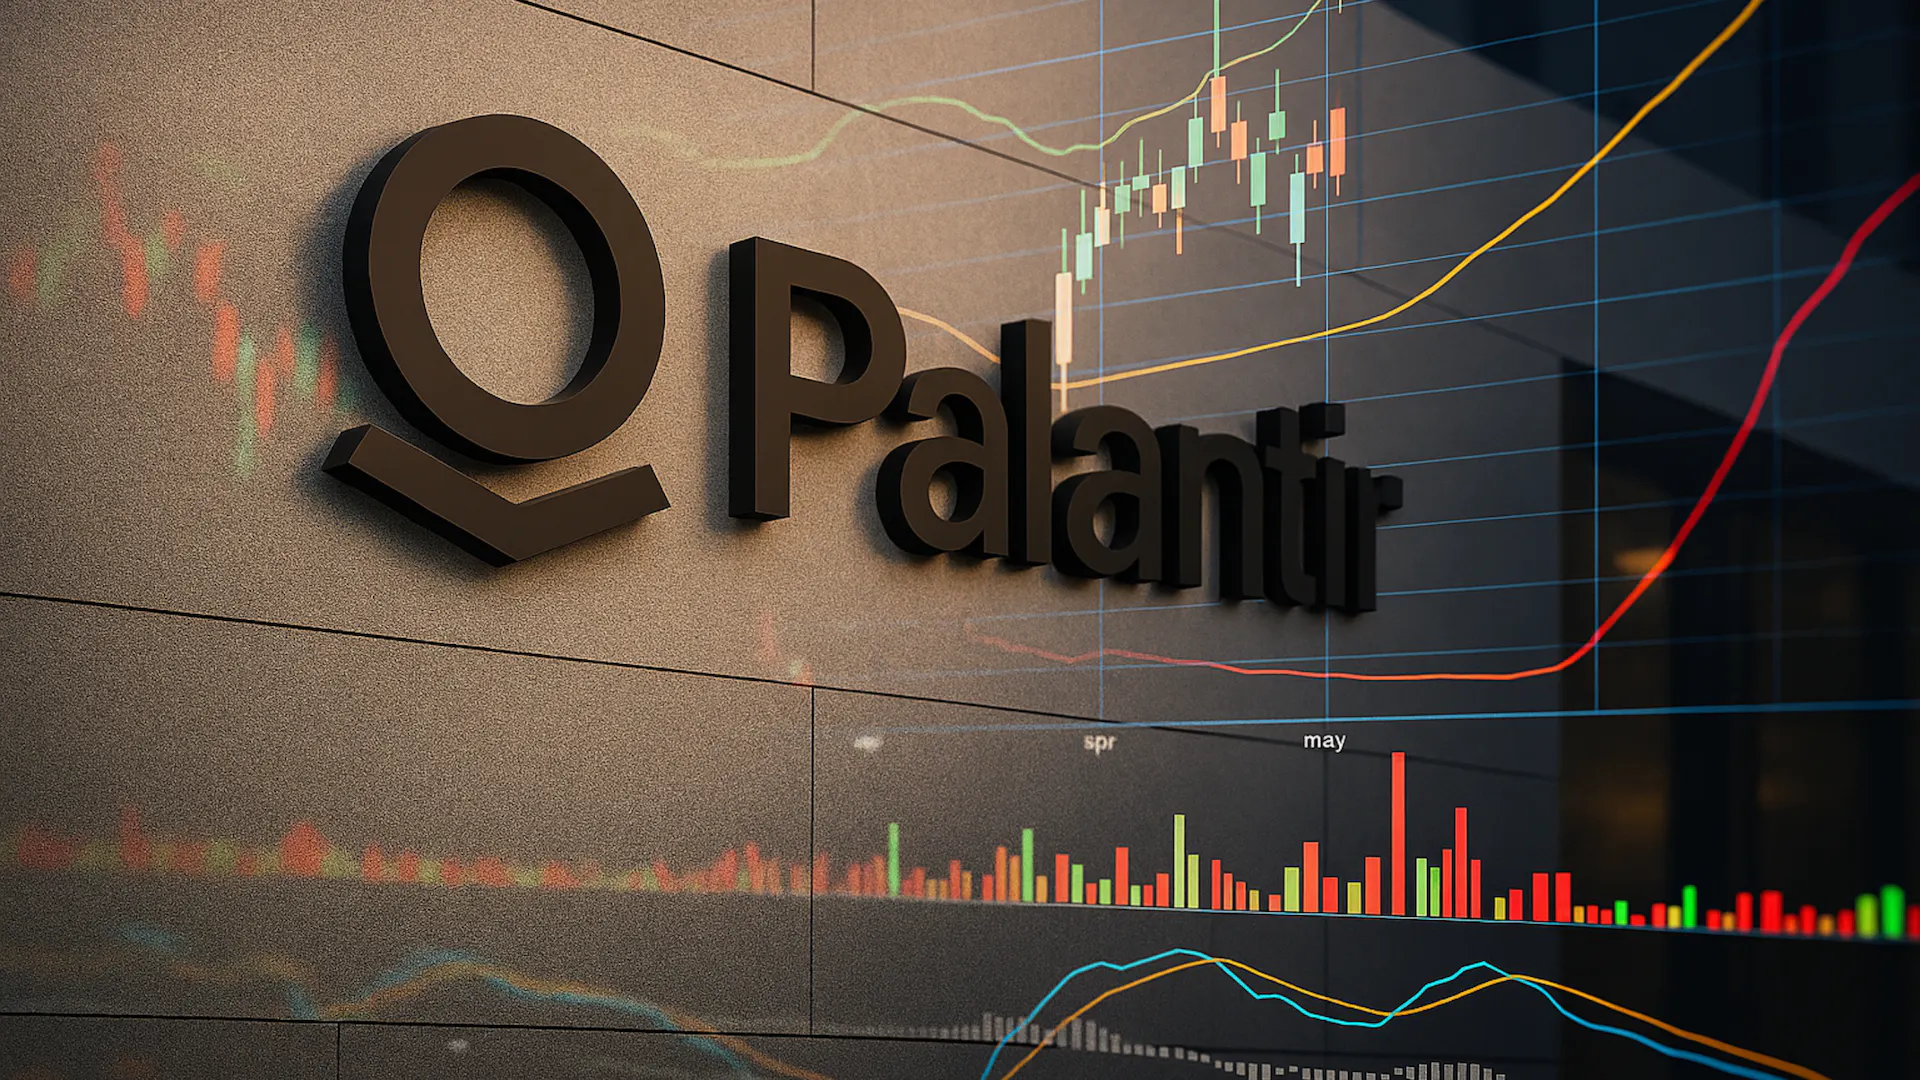
Palantir Stock is Out of Favor, but is the Growth Engine Still Intact?
March 13, 2026

Beth Kindig
Lead Tech Analyst
Palantir stock has softened alongside a broader software selloff, raising questions about whether its premium valuation is still justified. Beneath the muted price action, the company delivered sharp revenue re‑acceleration, triple‑digit U.S. commercial growth driven by AIP, expanding profitability, and record-leading metrics that suggest its long‑term growth engine could still be intact.
Palantir is Underperforming AI Hardware Stocks
Software stocks have been out of favor, with some down as much as 45%. Palantir’s stock is down about 10%, better than most software peers, yet it has still lagged AI hardware with stocks like Micron up as much as 50% year-to-date. Despite the softer price action, Palantir’s valuation still trades meaningfully above its 5-year and 3-year median.


Chart comparing Palantir’s forward price‑to‑sales (PS) ratio against its 3‑year and 5‑year median PS ratios. The forward PS line rises significantly above both long‑term medians, reaching 49.85 by March 2026, illustrating how Palantir’s valuation has expanded beyond historical averages. Source: YCharts
Palantir Stock Earnings: Revenue Re‑Acceleration and Margin Expansion
Palantir’s underlying fundamentals continue to challenge investors who believe real value is found in cheap stocks. This past quarter, the company offered a rare re-acceleration in growth with revenue accelerating to 70%, an impressive 57-point acceleration over the last ten quarters, while guiding revenue to accelerate further to 73.6% in Q1. US commercial momentum remained unphased, with revenue accelerating 16 points sequentially to 137% YoY, surpassing the $500 million mark in the quarter.


Chart illustrating Palantir’s year‑over‑year revenue growth from Q2 2022 through Q1 2026G, highlighting a powerful acceleration. This underscores Palantir’s strong multi-year revenue momentum and reinforces the narrative of accelerating demand by its AI platform.
I’m a growth investor through-and-through, yet it would be a mistake to think Palantir’s strength is found in the top line as I could point toward a dozen or more stocks with higher growth rates. Rather, it is Palantir’s ability to balance hypergrowth with profitability that sets it apart from SaaS peers. While revenue accelerated, profitability expanded alongside it: adjusted operating margin reached 57.4%, and adjusted EBITDA margin came in at 57%.
Palantir’s Rule of 40 (revenue growth + adjusted operating margin) rose to 127%, up 46 points YoY and 13 points QoQ, putting the company in a class of its own.


Palantir’s Rule of 40 came at 127% in Q4 2025, up 13 points QoQ and 46 points YoY.
Cash generation remained equally strong with adjusted free cash flow of $791M for a 56% margin in the quarter—while management guided for FCF margin to expand further next year.
US Commercial: The Key Driver of the Palantir Stock Bull Case
Palantir’s AIP-driven US commercial segment remains the company’s core revenue driver. In a series of previous analyses, my firm has covered key elements as to why the artificial intelligence platform (AIP) is able to drive such strong growth. To briefly review, Palantir’s Artificial Intelligence Platform (AIP) integrates generative AI with operational data and workflows, and, when combined with Palantir’s other platforms, Foundry and Apollo, it provides an AI service mesh that can run hundreds of microservices, scale compute via its Rubix engine, and orchestrate updates through Apollo.
The differences matter as unlike traditional AI-enabled database or business intelligence competitors, Palantir can operate effectively even when data sets are incomplete or fragmented—situations where most models struggle. In that regard, traditional business intelligence companies require a complete data set, whereas Palantir can handle situations where one isn't available. You can think of the competitive advantage as actionable depth, as Palantir has described it: “the reasoning that goes into decision-making, not just data.”
mid
Additionally, Palantir’s knowledge graph, referred to as Ontology, is a distinct advantage. The graph offers better context than a large language model would on its own – or as Palantir states, it’s “the reasoning that goes into decision-making.” Palantir made key upgrades to AIP with the introduction of AI-forward-deployed engineers (FDEs) and the AI Hivemind, and brought Ontology to the edge, enabling deployment on mobile devices.
Read more about Palantir’s products in our analysis “Palantir Stock 2026 Forecast: Is Its High Valuation Sustainable?” and Palantir Stock Forecast 2025
How AIP Is Powering Triple‑Digit Commercial Growth
In the prior earnings report, US Commercial revenue grew 29% QoQ and 121% YoY to $397 million in Q3, accelerating sharply and supporting the view that AIP is driving existing expansions and new customer conversions.
The acceleration continued this past quarter with US commercial revenue rising 137% YoY and 29% QoQ to $507 million in Q4. This led to a $2 billion annualized run rate in the quarter, up from a $1 billion run rate at the start of 2025.
With that said, Palantir’s International commercial revenue is not nearly as strong as US commercial with revenue growth of just 8% YoY and 12% QoQ to $170 million in Q4.


Chart displaying Palantir’s US Commercial year‑over‑year revenue growth from Q1 2022 through Q4 2025, highlighting the dramatic expansion of demand driven by the company’s AIP platform.
Palantir Stock Forecast: What Key Metrics Signal for 2026 and Beyond
Unlike 99% of other companies reporting this season, Palantir’s call offered little substance to sift through, with more clues on its growth opportunities hidden in the key metrics.
Palantir’s NRR expanded 5 points to 139% in Q4; on a YoY basis, NRR has risen 19 points. In the earlier thesis, Palantir’s NRR had already been expanding (to 134% in Q3), with management emphasizing that the metric does not capture revenue from new customers acquired over the last twelve months—meaning upside can still be building beneath the surface.
RPO then surged in Q4—up 62% QoQ and 143% YoY to $4.21 billion—while billings rose 91.1% YoY and 21.5% QoQ to $1.49 billion. Both of these key metrics witnessing this sharp step-up in tandem provides further confidence in Palantir’s 2026 accelerations panning out with the potential for upside to its initial guidance as each quarter progresses.
Palantir also booked record TCV of $4.26 billion, up 138% YoY, with commercial TCV of $2.6 billion, up 161% YoY and 83% QoQ.


Chart showing Palantir’s remaining performance obligations (RPO) from Q1 2023 through Q4 2025, highlighting a substantial increase from $0.94 billion to $4.21 billion over the period. This sharp expansion signals a rapidly strengthening multi‑year demand pipeline, reinforcing Palantir’s visibility into future revenue and supporting expectations for continued acceleration in 2026.
The Other Side of Palantir's Story: Government Likely to Strengthen
Palantir recorded its best week since August as conflict in Iran broke out, as analysts were quick to point out that the conflict would help Palantir prove its value to the US military and continue to see strong government-driven deal momentum.
Palantir’s exact role in the conflict is a bit unclear, as some reports suggest that Palantir’s Maven Smart Systems, powered by Anthropic’s Claude AI, was utilized to integrate fragmented data from multiple US agencies, from drone footage to satellite imagery and radar signals, to help map military movements, what other LLMs are not necessarily capable of doing. However, the Pentagon’s growing disputes with Anthropic, which saw the government deem Anthropic as a ‘supply chain risk’, could hinder its role, as defense contractors such as Lockheed Martin are expected to work to remove Anthropic from their supply chain per the Pentagon’s orders.
Despite that uncertainty, Palantir’s platform does remain model agnostic and analysts believe there are ‘adequate alternatives’ to Claude that could be utilized, while the broader theme of conflict and the Defense Department saying they would award “bigger, longer contracts” for proven weapons systems support growth in Palantir’s government pipeline. As a reminder, Palantir had already won a $10 billion contract with the Army last summer, and any indication that increased government deal volumes for AI solutions could flow through to Palantir.
Palantir’s government remained strong with 60% YoY and 15% QoQ growth in the fourth quarter to $730 million, and government accounted for nearly 52% of revenue in Q4. Palantir highlighted mission impact across the DoD and momentum in civil agencies, including an up to $448 million contract with the US Navy to modernize the shipbuilding supply chain and accelerate delivery of naval vessels.
Margins and Cash Flow Are Reinforcing the Operating Model
As stated earlier in the analysis, Palantir’s Rule of 40 score expanded 46 points YoY to 127%, which the company defines as revenue growth plus adjusted operating margin. Adjusted operating margin in Q4 was a record 57.4%, while Palantir guided for adjusted operating margin to remain strong next quarter at 56.8% at midpoint.
Cash flows remain best-in-class with management guiding for adjusted free cash flow margin to expand in 2026 from an already strong 51% in 2025, projecting adjusted FCF up more than 77% YoY to $3.925–$4.125 billion.
Why EV/EBITDA Shows Palantir Is Cheaper Than It Appears
When we revisit valuation, we see that Palantir’s strong bottom line has resulted in an EV/EBITDA that is as low as the April 2025 selloff – reinforcing the fact that Palantir is more of a bottom-line story than a top line story in terms of what truly sets the stock apart:


Chart showing Palantir’s EV/EBITDA ratio that is as low as the April 2025 selloff. Source: YCharts
Will Palantir’s 2026 Setup for Beat/Raise Potential Mirror 2025?
For 2026, Palantir initially guided for fiscal 2026 revenue to accelerate from 56.1% to nearly 61% YoY, driven by US commercial revenue accelerating six points to >115% YoY. Driving such an acceleration at these growth rates is undeniably difficult, yet there are hints that Palantir could go above and beyond these figures by this time next year.
Looking back to 2025, Palantir’s beat/raise pattern offers a framework for how 2026 could play out if key metrics continue to strengthen. In 2025, management’s initial guide proved conservative as the year progressed; the open question now is whether Palantir can deliver similar upside from a higher revenue base.
For example, in Q4 2024, Palantir had initially guided for roughly 30.8% YoY growth in FY25. This was then raised to 36% in Q1, then again to 44.7% in Q2. By Q3, Palantir’s FY25 guide was raised to 53.5%, before ending the year with growth of 56.2%, more than 25 points faster than originally anticipated four quarters prior. FY26 is already starting off at 60.6% projected growth, with all four quarters to go.
Technical Analysis: Where Palantir Stock May be Headed Next
Palantir has been tracing a large 5-wave pattern off the 2022 low. Regardless of how the internal waves are organized, the pattern remains incomplete to the upside — meaning the larger uptrend is still intact, and the current weakness is most likely just a correction. That said, given the magnitude of this 5-wave structure, investors should expect corrections of a larger degree than what they have experienced during the earlier stages of this advance.
Price action currently supports two scenarios:
Primary Count — A sustained break above $195 would invalidate the primary count and instead project a 5th wave advance toward the $240 region. This would complete the larger 3rd wave patern, as the final push higher will be met with lower volume and momentum as we push higher. Once completed, it will give way to a multi-month 4h wave decline.
Alternative Count — We are in a significant 4th wave decline. The current bounce is expected to fail somewhere in the $186 — $195 range before rolling over into a final leg lower. Target support for the completion of this 4th wave sits between $119 and $87. The line in the sand for the entire bullish thesis is $66. A close below that level would cast serious doubt on the continuation of the larger uptrend.


Chart displaying a long‑term Elliott Wave analysis of Palantir (PLTR) from late 2023 through 2026, mapping out impulsive waves (1–5) followed by an ABC corrective structure. The price action shows a strong uptrend through waves (1), (2), (3), (4), and (5), with Fibonacci extension targets marked above current levels, including 236%, 250%, and 261.8% projections ranging roughly from the mid‑$200s to nearly $400. The chart also outlines potential corrective zones labeled (A), (B), and (C), with support areas between approximately $87 and $120 highlighted as key downside levels. Trendlines and moving averages show broader upward momentum, while future price projections extend into 2027.
Conclusion:
Palantir’s Q4 report showed that the company’s AIP-driven momentum remains robust with no signs of slowing, further supported by most key metrics accelerating in unison. Palantir’s NRR expanded 5 points to 139%, its Rule of 40 score expanded 46 points YoY to 127%, and record TCV and RPO were the cherry on top of a strong quarter.
Palantir also guided for revenue to accelerate to nearly 61% YoY in 2026, driven by US commercial revenue accelerating to >115% YoY. Driving an accelerate at multi-billion dollar scale is difficult, yet the company’s key metrics suggest growth rates may continue to move higher.
Lastly, on valuation, the bottom-line ratio is more favorable than the sales multiple implies, as earnings power has improved due to the company’s margin expansion. Nobody has a crystal ball, but the company’s fundamentals suggest Palantir is positioned to trade higher than where it sits today if execution remains intact.
Since our inception in May 2020, I/O Fund has delivered a cumulative return of 326%— if we were a hedge fund, we’d rank #1 and if we were a tech ETF or Mutual Fund, we’d rank #3 in the United States.
Being early to many lesser-known AI winners helped us to achieve these results. To get our Top 15 AI stocks, real-time trade alerts, weekly webinars and deep-dive research from a proven team in AI and tech stocks, Sign up now.
Please note: The I/O Fund conducts research and draws conclusions for the Fund’s positions. We then share that information with our readers. This is not a guarantee of a stock’s performance. Please consult your personal financial advisor before buying any stock in the companies mentioned in this analysis.
Recommended Reading:


More To Explore
Newsletter

Token Growth is Surging - Here Are the Beneficiaries
The reality of AI demand growth has shattered early estimates for token processing, yet expectations continue moving up and to the right. In the second installment of our token processing series, we e

AI Token Demand is Shattering Forecasts
Total annual token processing is no longer measured in billions or trillions of tokens, but in the quadrillions and beyond. As annual token processing is now tracked in units with 15 trailing zeros, i

Nvidia and Google Are Crowding TSMC’s N3 Node - Can Intel Fill the Gap?
Nvidia is moving its next-generation Rubin GPUs from 4nm to 3nm, yet Google’s latest TPUs are already on N3 and are expected to remain there. Meanwhile, a growing number of AI CPUs from Nvidia, Amazon
Intel vs TSMC: How CoWoS Packaging Constraints Could Create an Opportunity for Intel Foundry
Taiwan Semiconductor (TSMC) is the single, most important company to the AI industry. However, to compete with the incumbent, Intel does not need to beat TSMC at leading-edge manufacturing. It only ne
Big Tech’s Free Cash Flow is Turning Negative – Who's Next?
Big Tech’s AI revenue is accelerating, but free cash flow is moving sharply in the opposite direction. Across Google, Microsoft, Meta and Amazon, capex is rising much faster than operating cash flow a
Big Tech Earnings Preview: Is AI Monetization Finally Catching Up to Capex?
The most pronounced difference between 2026’s tech rally compared to rallies in the past is which companies have been left out of it. The names most associated with the AI trade have hardly participat

Nvidia, CXL, and the Battle to Improve AI Inference Economics
This is Part 2 of our two-part series on AI inference economics. In Part 1 — Why Nvidia's Next AI Battle Is About Tokens per Watt, we laid out why tokens per watt has become the defining metric for in

Why Nvidia’s Next AI Battle Is About Tokens per Watt
As hyperscalers move from building AI infrastructure to monetizing it, tokens per watt helps to reflect if revenue is scaling and if profitability is improving. Offload engines can increase tokens per

Micron Is Up 900%. Here’s Why the AI Memory Trade May Still Have Room to Run
Over the past 10 months, memory chip stocks have gone from being solid beneficiaries of the AI boom to capturing a massively outsized piece of the return pie. The inflection in Micron’s performance de

Why the S&P 500 Shrugged Off the Iran War — and What Could Finally Break the Rally
On February 28th, the U.S. went to war with Iran, and the market was handed the kind of shock it hasn't contended with for years. The conflict set off a chain reaction across the region: an ongoing su
