Stocks, Oil and the Dollar
September 15, 2023

Knox Ridley
Portfolio Manager

In last week’s article, we discussed the general path the SPX will likely take into the end of the year. In brief, we are expecting volatility to continue with a test of the 4275 SPX region, then a final push to new highs, which could take us into Q1 of 2024. The current macro environment is not signaling a near-term recession in the US now, so absent of an unforeseen event, we do not see the July top as anything more than a correction.
However, markets do not move in a vacuum. There is always a market ahead of the one you are tracking, and seemingly unrelated markets often drive the very one you are most exposed to. Our portfolio management discipline is to track various key markets, as it’s quite evident that tangential markets are inter-related. When doing so, the picture that emerges is not one that supports an uninterrupted bull market.
The two most important markets that are driving the S&P 500 is oil and the US dollar. Both are suggesting a continuation of the equity rally for another leg higher, but then the also suggest a return to volatility over a longer time horizon. In this article, we will examine the levels that must hold, as well as introduce the important supporting markets to track right now so that one can maneuver any further upside in the markets as well as the coming volatility that may follow.
Growth, Inflation and Recessions
Markets do not crash randomly. They crash as a result of economic growth decelerating below expectations, which simply cannot support equity valuations at the time. With the FED wrapping up one of the most aggressive rate hike campaigns in modern market history, investors are now left wondering if those rate hikes will filter into the economy enough to cause an unexpected decline in economic growth. We believe the lag effect on these rate hikes is giving the illusion of safety, with the effects of this campaign most likely to show up in late Q4 of 2023 – Q1 of 2024. When economic growth decelerates too much, that is usually the environment that we see deep market declines.
That being said, investors betting on a crash now will likely be disappointed. If we examine the trend in US growth, there is simply no evidence of an impending recession. The below graph looks at the 3-month annualized trend in various metrics ranging from the consumer’s health to employment. Simply put, this is not what you see going into a recession, nor do they signal a recession is just over the horizon.

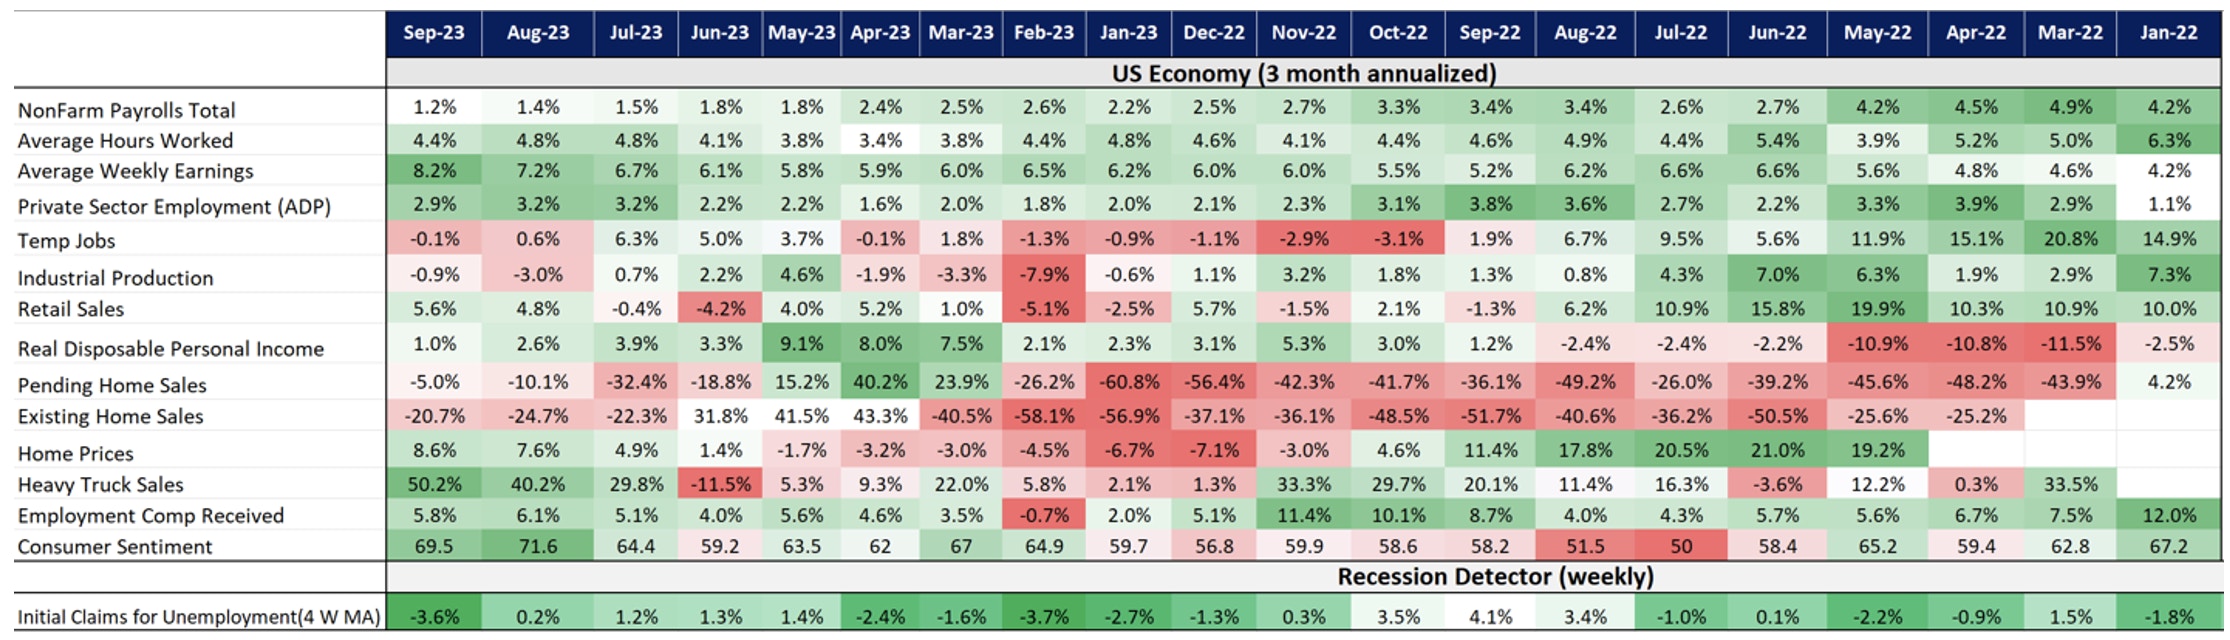
Furthermore, we tend to see initial unemployment claims spike relatively close to market tops. As of now, this metric is signaling that the July top is likely nothing more than a correction within a larger trend higher. Employment is not weak enough, nor is the consumer weak enough to suggest that a recession is just over the immediate horizon.
While the US economy has remained resilient for most of 2023, we have also seen a high level of disinflation, as well. While the YoY CPI numbers are still a far cry from the FED’s 2% target, coming in recently at 3.7%, the 3-month annualized trend is an encouraging step towards that goal. Keep in mind, in order to get to the YoY target, you need to see several months in a row of the 3-month annualized trend come in at, or below your target. So, this trend is encouraging.

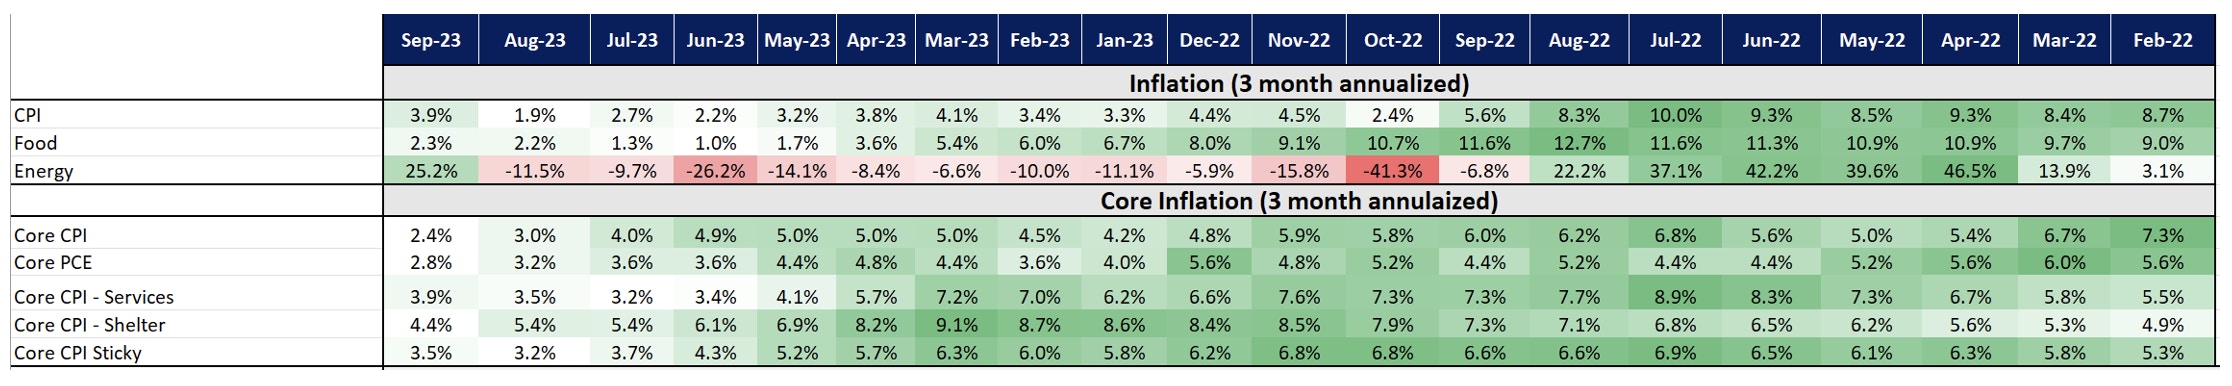
However, when you dig under the surface of what’s driving the current level of disinflation, a concerning picture emerges. There are only three general drivers within the CPI print – energy, food, core inflation.
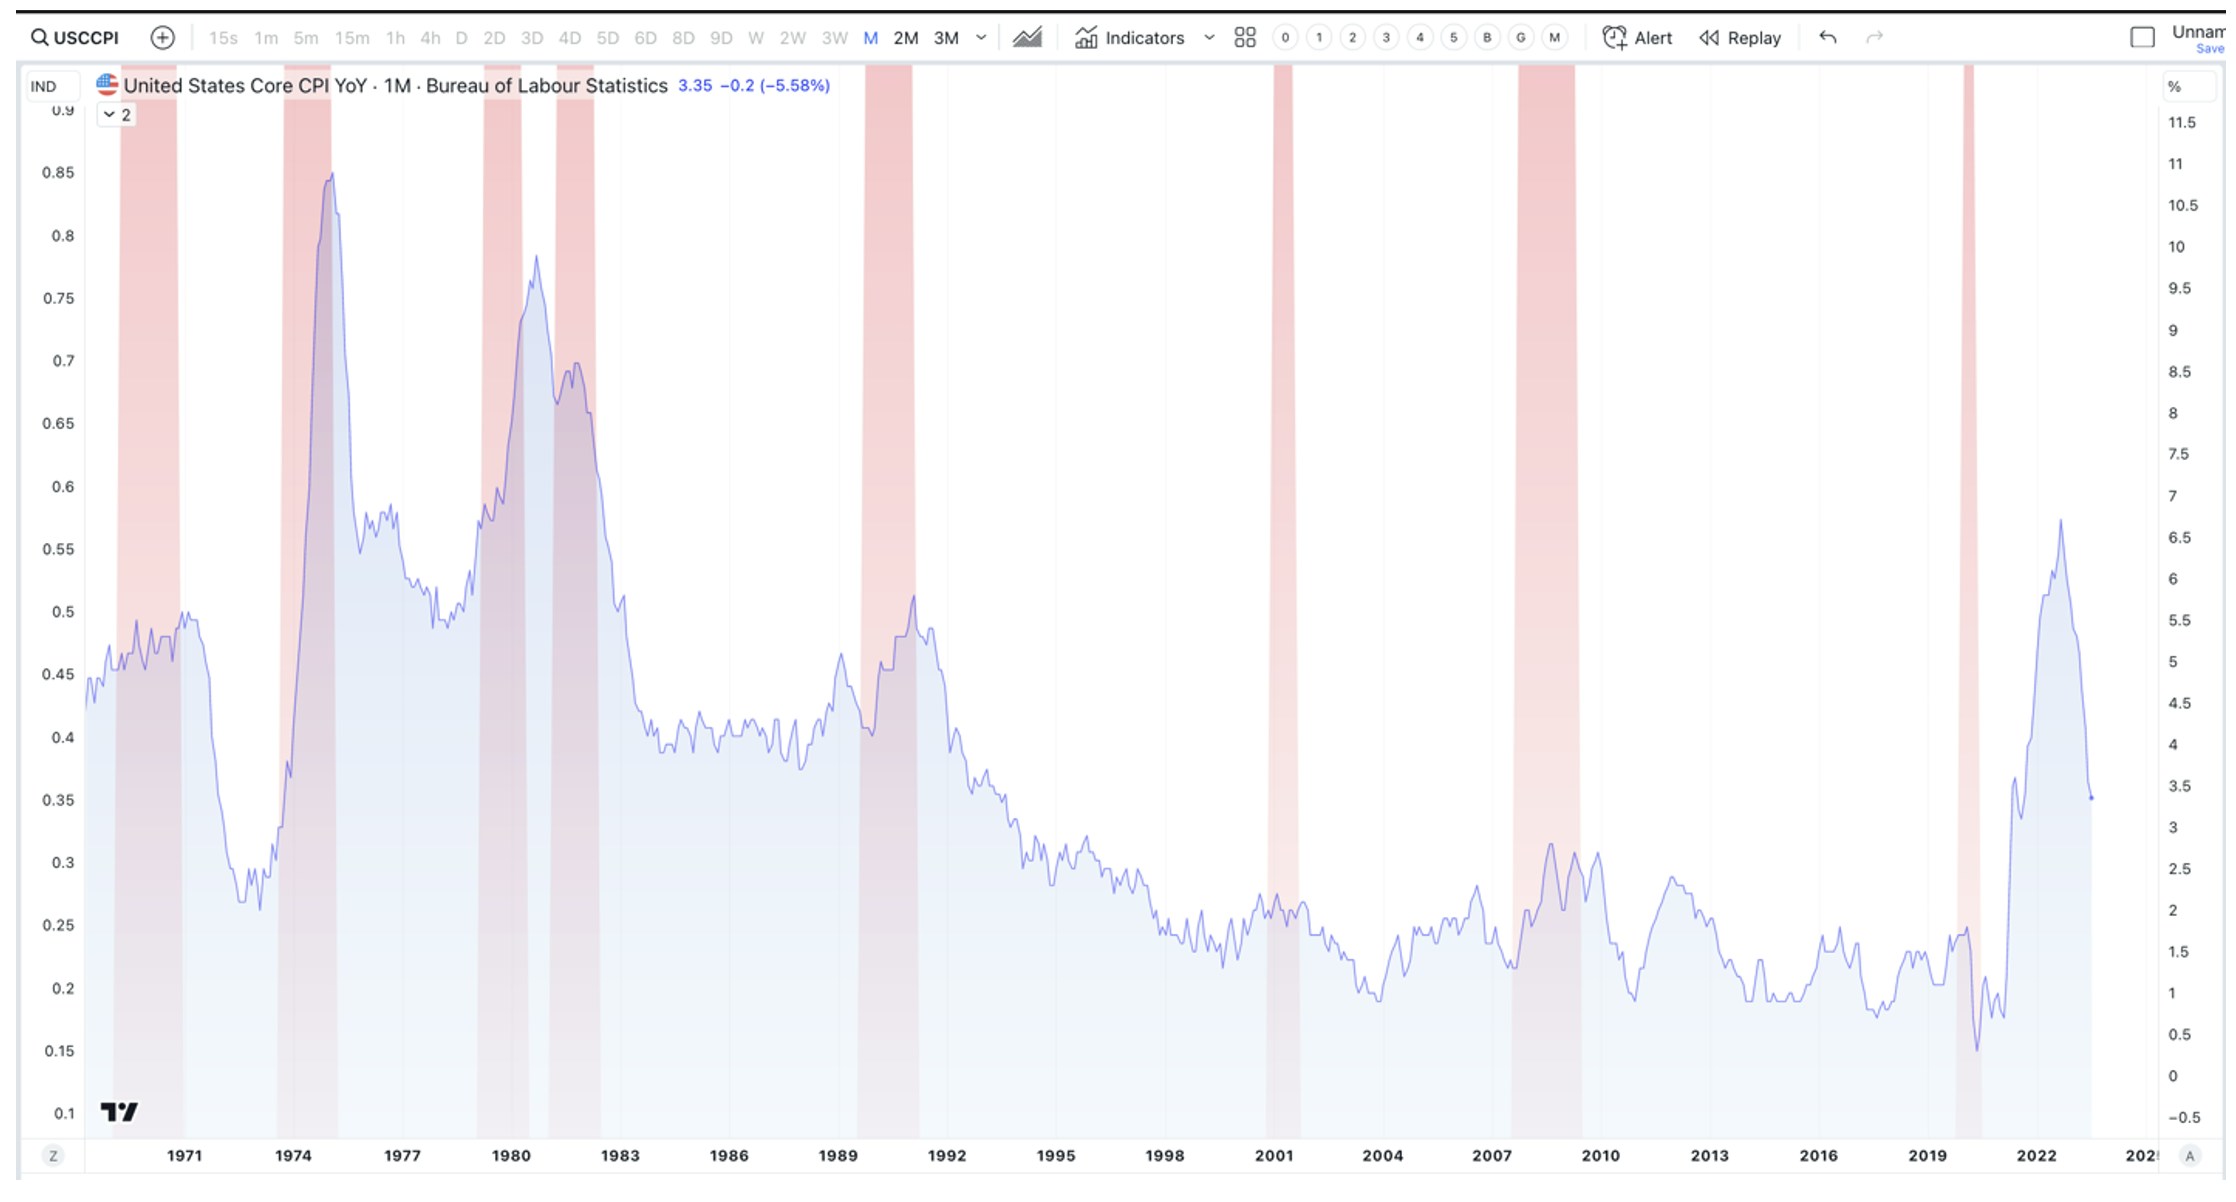
The 3-month annualized trend in core inflation has remained within the 4% - 5% for over a year, with our first move towards 3% - 2% in the last print two prints. While this is a move in the right direction, keep in mind that the YoY print for Core CPI is 4.3%. This is still more than double the FED’s target.
This falls in line with what market history has taught us about inflation and recessions. Once core inflation gets out of control and moves well above the FED’s target for that business cycle, it requires a recession to get it back in line. More importantly, there is no instance in modern market history where core inflation has naturally gone back to the FED’s target without the help of a recession. The last two shoes to drop in the business cycle are always employment, then inflation, which is exactly what we are seeing right now.

So, while the trend in core inflation is promising, a current YoY reading of 4.3% is still too far away from the FED’s target of 2%. This means that energy has been the primary driver of the current disinflation trend, which is obvious in the graph above. For this reason, oil prices are crucial right now in confirming what equity prices have priced in – the FED pausing further rate hikes. If oil continues higher, inflation will certainly come back, forcing the FED to continue raising higher than equity valuations are currently priced.
Oil
From its high just under $130/barrel in March of 2022, to its low just above $63/barrel on May of 2023, crude oil has seen a +50% drawdown over 14 months. This deceleration in oil caused the disinflation that equity prices are celebrating, as core inflation remained virtually unchanged during that time
However, since the May low, crude oil is up over 30%, making its first series of higher highs and higher lows in over a year. What this means for future inflation readings is that energy will actually hurt the disinflation narrative, meaning that core inflation will have to decelerate to pick up the slack. Considering the health of the consumer, coupled with the lessons in history, we find this to be unlikely.
However, it’s important for investors to understand that equities are forward looking. As oil prices broke out to a new high in early August, equities topped one week prior, causing the drawdown we are currently in. Technically, the odds favor a larger uptrend in oil prices over the coming year; however, we just completed a 5-wave pattern off the May low. What follows this pattern is usually a 3-wave retrace of the same degree.

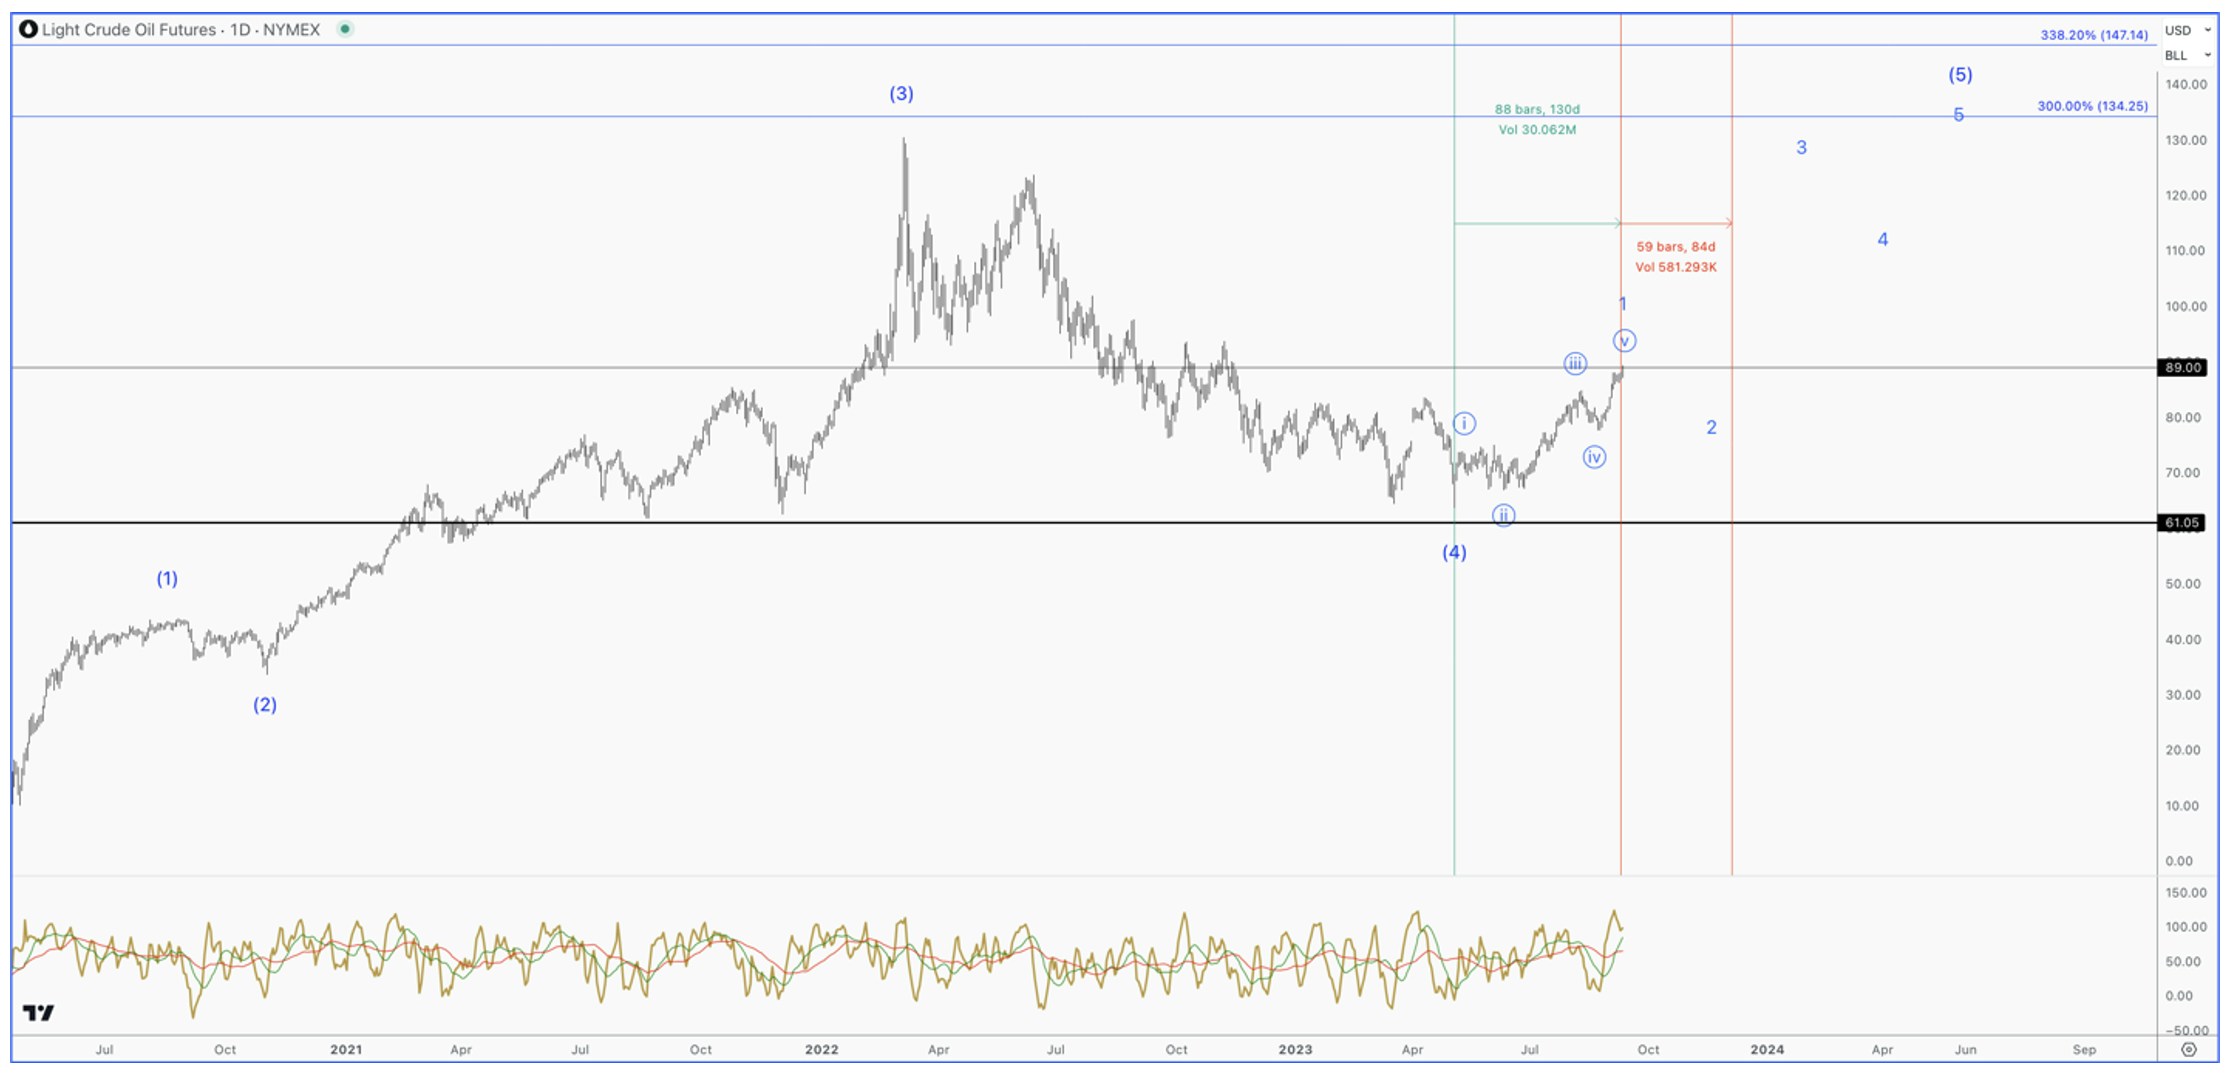
In other words, the 5-wave uptrend took about 4 months to complete. So, I’d expect at least a 2-3-2 month retrace over the coming months. If oil gives us a proper pullback, which it seems likely, expect equities, especially tech, to continue higher. This sets us up for that final push higher into early 2024.
The US Dollar
My favorite means of tracking the US dollar (USD) is through the dollar index (DXY). This is simply an index of popular currency pairs to the USD that has a lot of price history to analyze. What is undeniable in this market is the inverse relationship between DXY and US equities.

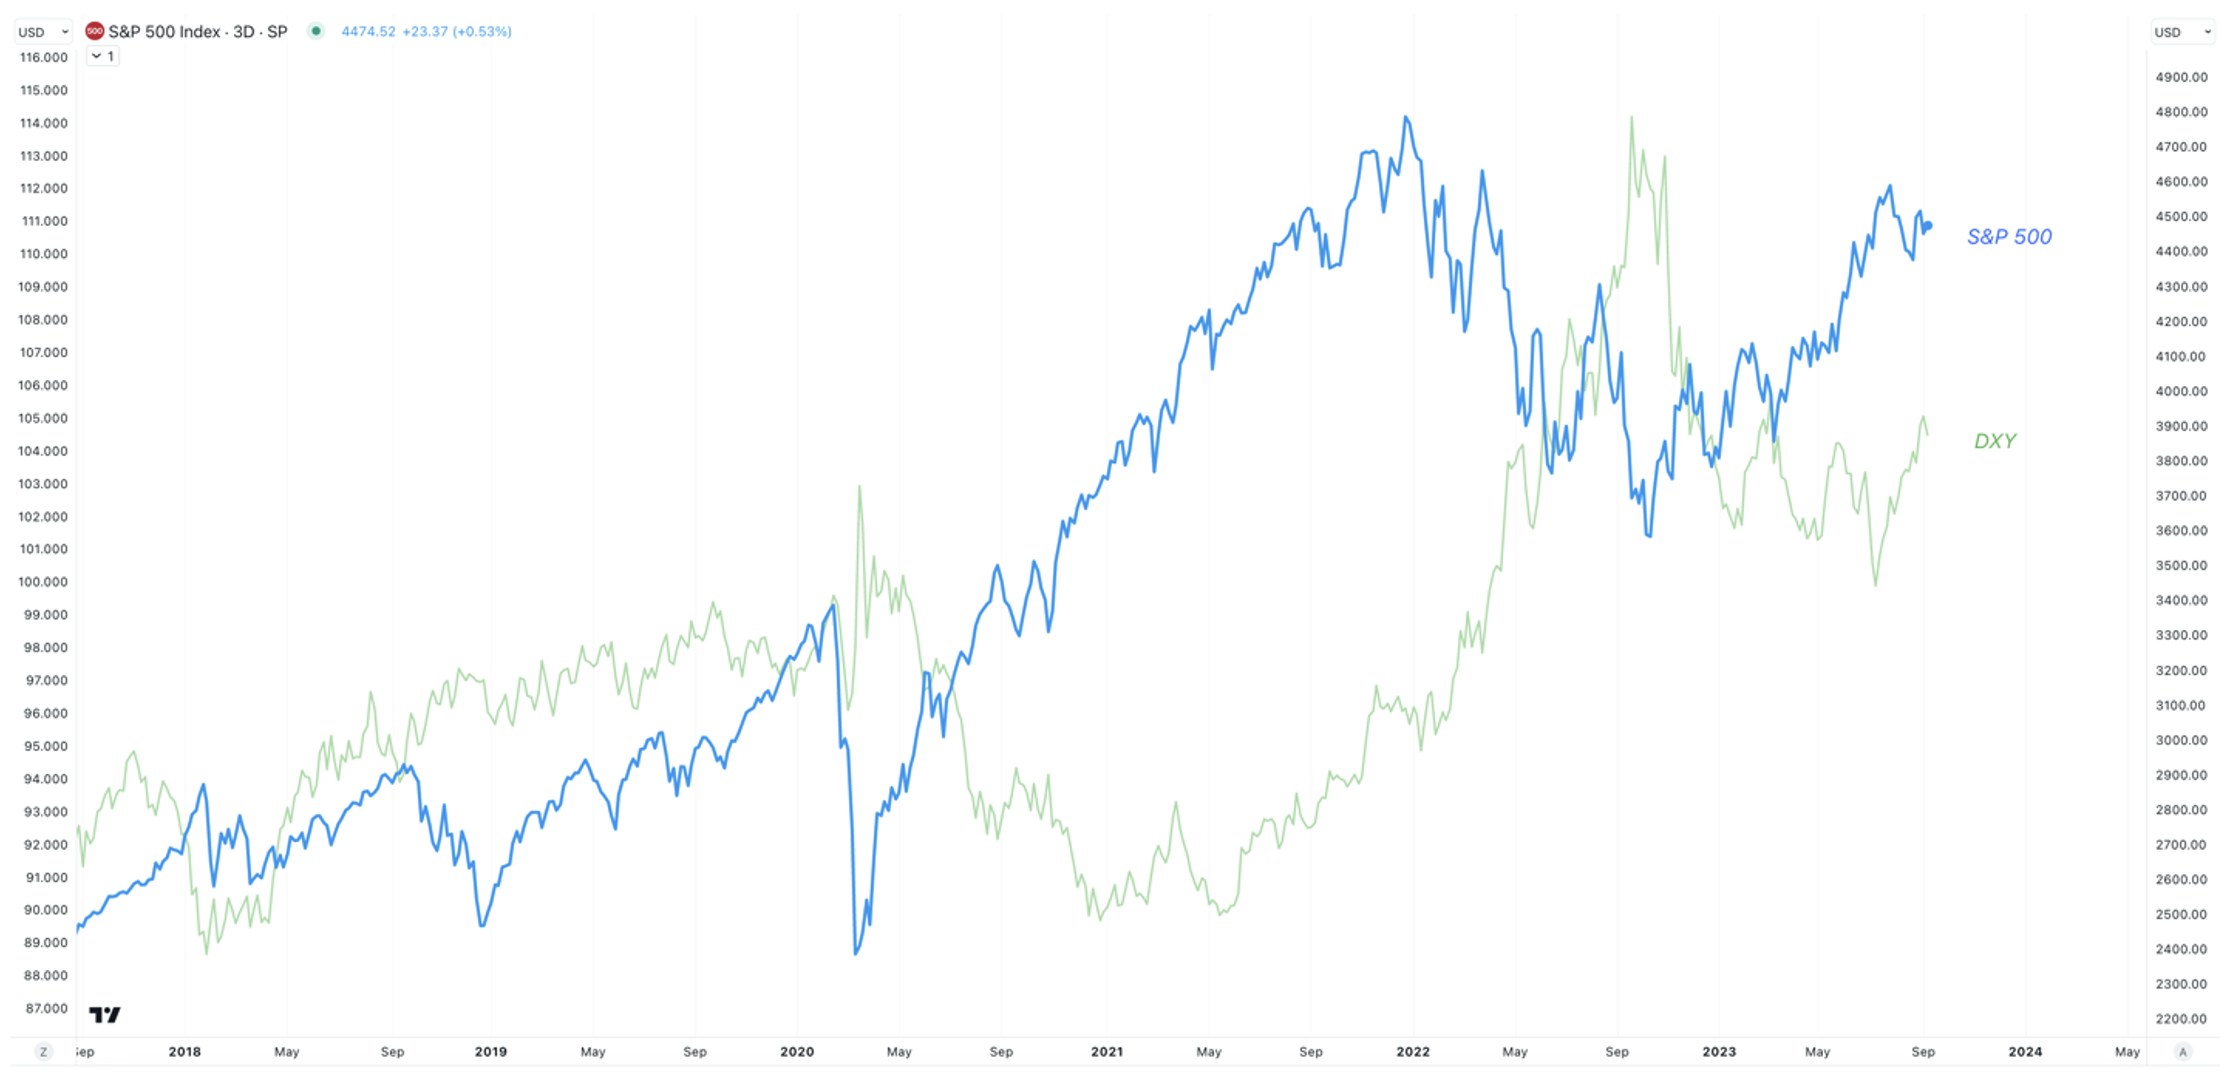
The reason for this relationship is based on the abundance of global debt denominated in the US dollar. Some estimates claim that $12 Trillion of global debt is denominated in the US Dollar, while others have claimed its even as high as $65 Trillion. This would be debt in US dollars coming from non-US banks and shadow banks. These figures are in relation to a global GDP of $104 Trillion.
Regardless of the actual denomination, with so much global debt priced denominated in dollars, when the dollar goes up in value, compared to a country’s own currency, the cost to service this debt is also going up. This drains liquidity from that foreign economy, which is less money to spend on stocks. Adversely, the opposite is true, which is one of the reasons why we have seen such a sharp increase in US equities. As the dollar has dropped sharply from its high, global liquidity has also bottomed and slowly trended up.
If we analyze DXY, it appears to be in the final stages of the corrective rally within a larger correction. It hit the lower target around $105; however, the structure looks like it can extend towards $107 in the coming weeks.
Sign up for I/O Fund's free newsletter with gains of up to 221% - Click here

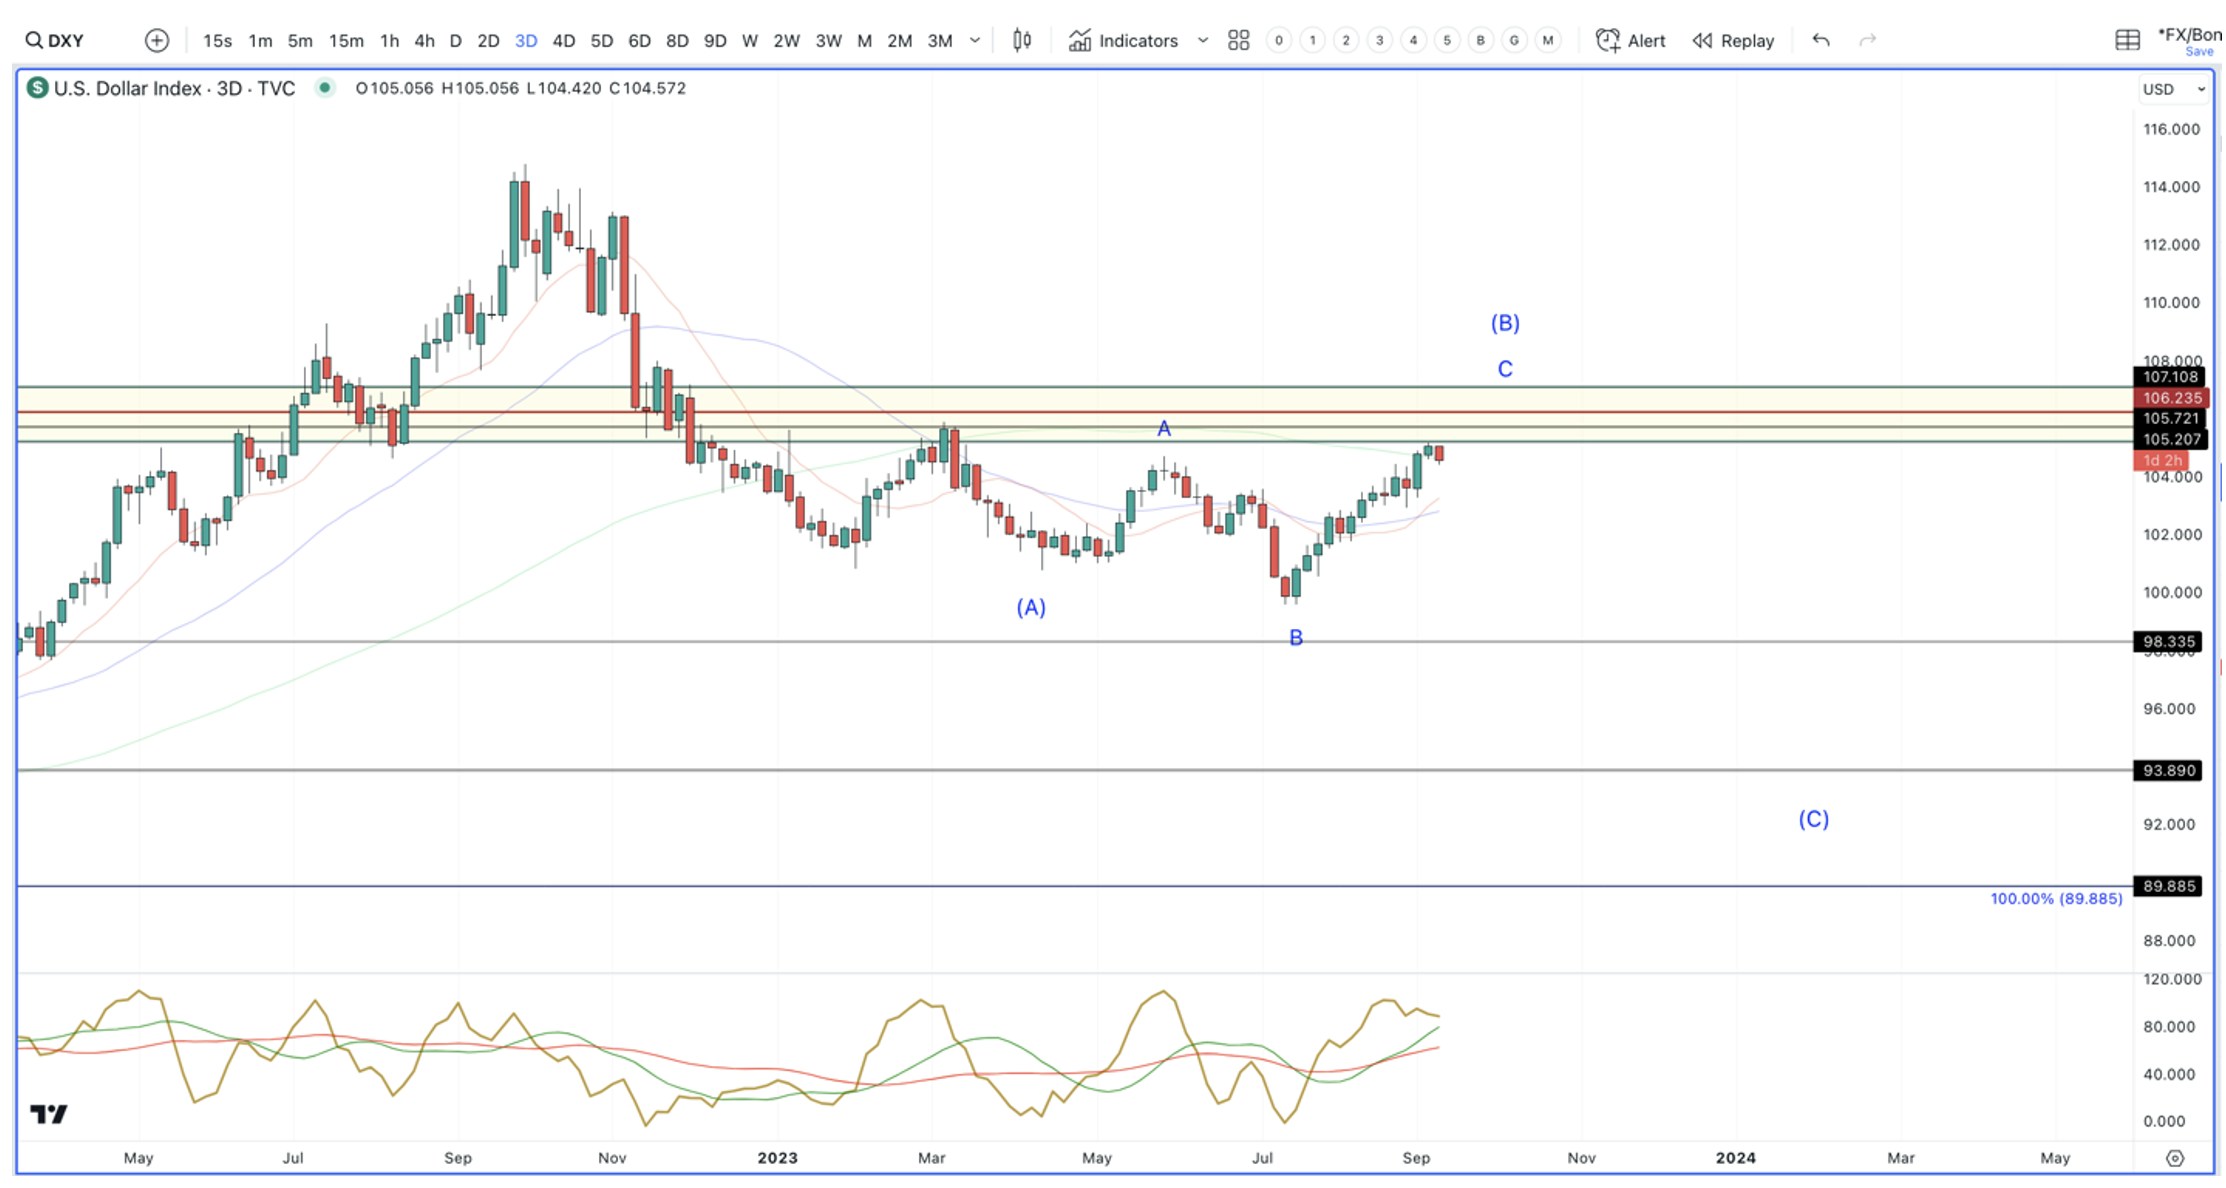
As long as DXY goes up, expect volatility to continue in the markets. However, what is encouraging is that once this corrective rally terminates, we should see a final leg lower in DXY, which will also support another rally in equities.
Broad Market Levels
It is our belief that we are about to start the final leg higher in equities before topping. This is supported by two of the most important markets that have a significant effect on equity prices. The catalyst for a larger top will likely be a recession. Absent of an unforeseen event, our timing of this recession is November 2023 – March of 2024. The above supporting markets also line up with this thesis – Oil and DXY should see a multi-month decline, which will support equities moving higher. However, these moves will be a correction in much larger trends.
Regarding price levels, our belief is that the broad market is in a correction, which should make another move lower into late fall/early winter. Confirmation of this move will be a break below 4430 SPX, and our targets for the last leg in this correction will be around 4275 SPX. This is laid out in the green count below.

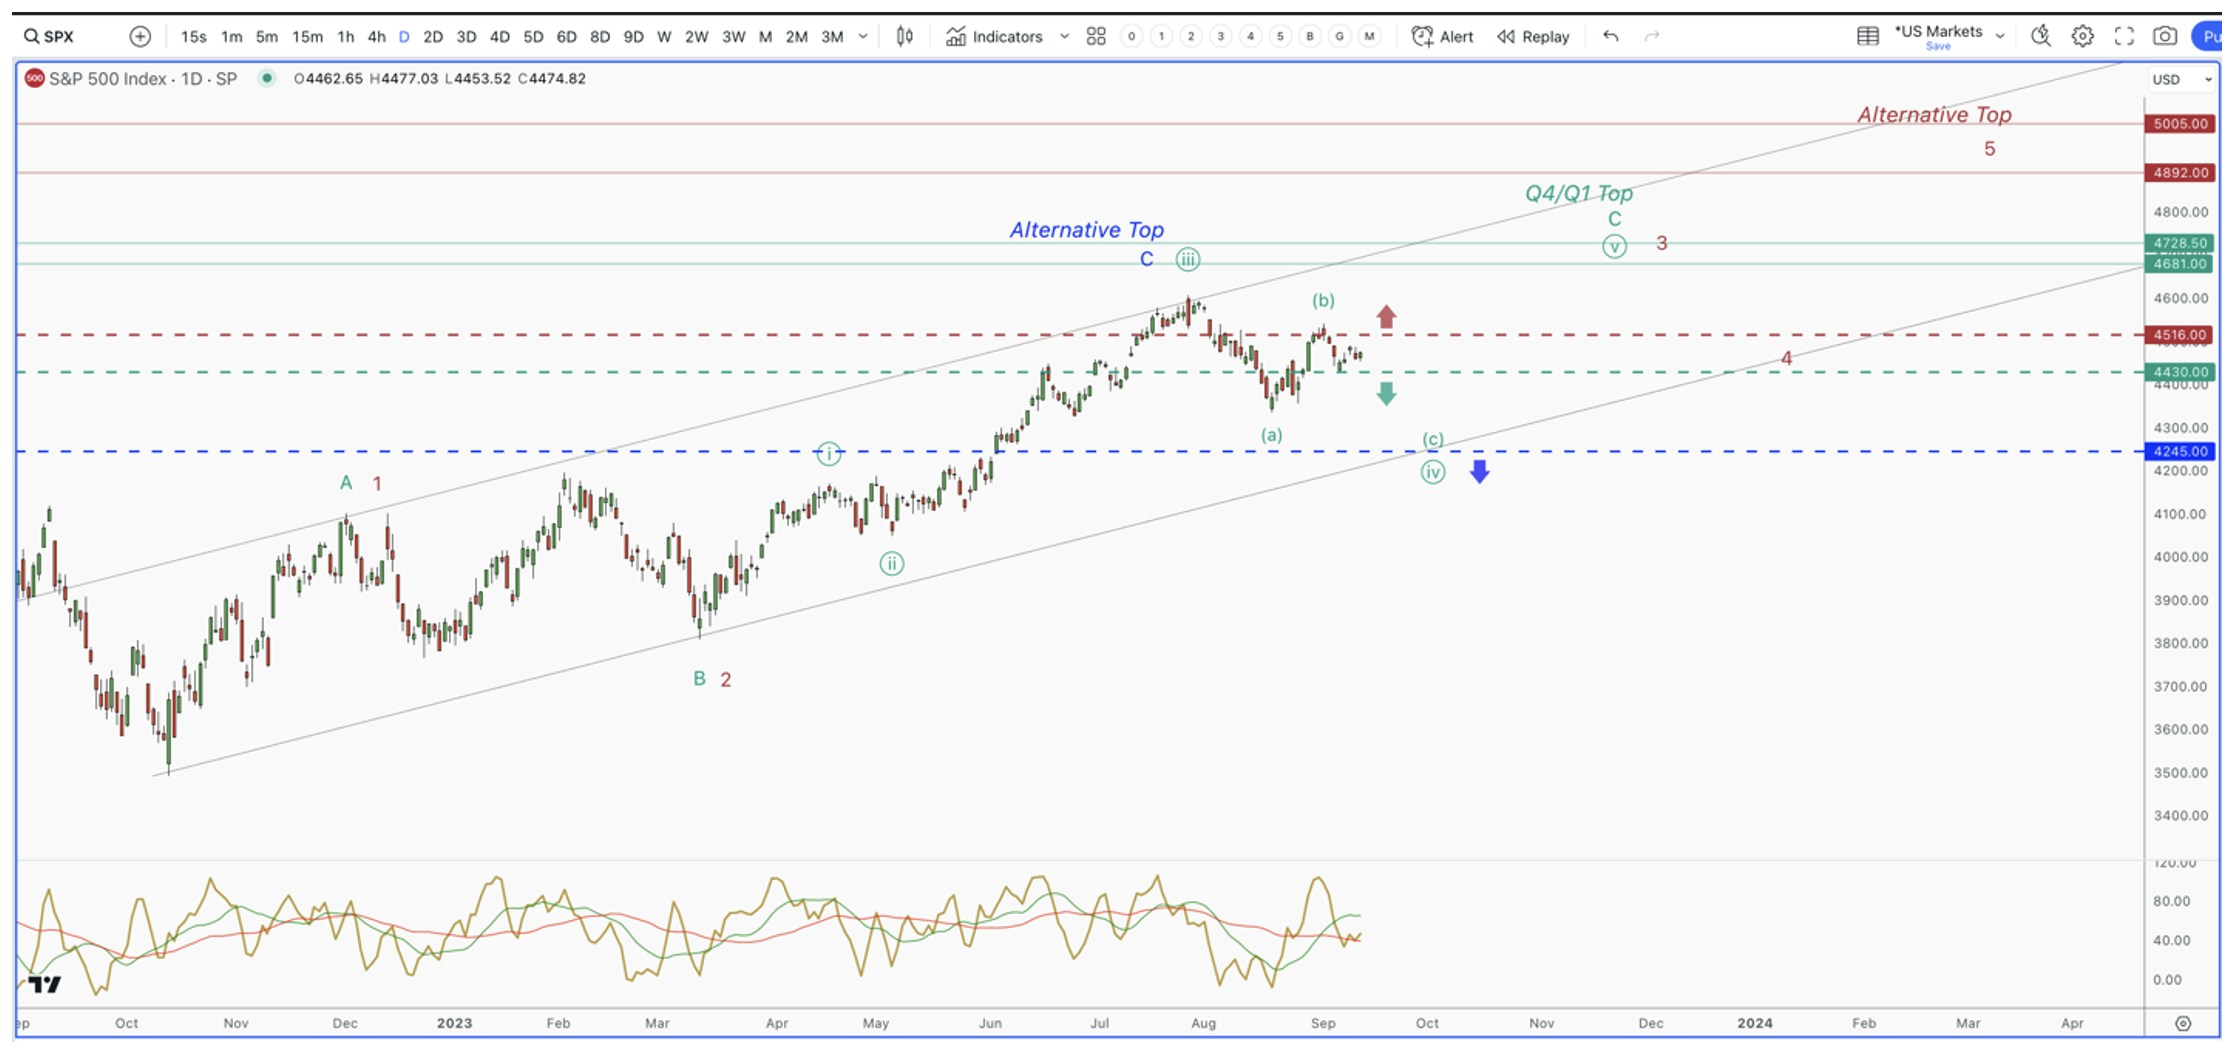
However, I cannot ignore that the bears have, so far, been unable to take advantage of the setup pointing us lower. For this reason, I’ve added the red count to the chart, which suggests a direct push towards 4700 – 4800 SPX. If we see the market breakout above 4516 SPX, this will become my primary expectation.
The final alternative count is in blue. This will not be considered until we see a break below 4245 SPX. If this does happen, it will make the probabilities of a major top being in, and we will risk manage accordingly. As I do not see any evidence of a recession brewing now, this blue count would likely be the market picking up on some type of event.
In conclusion, there are three broad market levels investors need to focus on in order to best risk manage their portfolios into the end of the year. We do believe that we are marching towards a recession, but that recession is not in the data now, which favors higher levels. But, based on the trends in oil and the US dollar, which are key markets driving equity returns, any additional upside should be met with caution until the macro environment changes.
Due to these dynamics, we believe the odds of a final swing higher are quite high. If we get confirmation of this move, we will target 4700 – 4800. Our plan is to trim substantially when we get to this region, and play defense until the market and economy proves otherwise. If we see a continuation of the current correction we are in, we consider it to be a buying opportunity as long as we stay above 4245 SPX. Below this level, and a major top is likely in.
What’s Next
If you want to track the potential top in equities, join I/O Fund next Thursday, September 21st at 4:30 pm EST, for our premium webinar. We will go over in detail all possible scenarios, plus the levels that need to hold that can confirm what is likely playing out. We will also go over the specific AI stocks we are targeting for this final run higher, as well as our game plan for when we confirm a top.
Disclaimer: This is not financial advice. Please consult with your financial advisor in regards to any stocks you buy.
Recommended Reading:


More To Explore
Newsletter

Micron Is Up 900%. Here’s Why the AI Memory Trade May Still Have Room to Run
Over the past 10 months, memory chip stocks have gone from being solid beneficiaries of the AI boom to capturing a massively outsized piece of the return pie. The inflection in Micron’s performance de

Why the S&P 500 Shrugged Off the Iran War — and What Could Finally Break the Rally
On February 28th, the U.S. went to war with Iran, and the market was handed the kind of shock it hasn't contended with for years. The conflict set off a chain reaction across the region: an ongoing su

Nvidia, CoreWeave, and Nebius: Inside the Circular Financing of the GPU Boom
Neoclouds are one of the more hotly debated AI business models, with CoreWeave and Nebius being the two most widely recognized names. These companies have seen their sales, backlog, and share prices s
AMD, Nvidia, Arm, Intel: Inside the $120 Billion CPU Gold Rush
CPUs have gone from an afterthought to becoming the AI trade’s next great bottleneck – and with AMD, Nvidia, Arm and Intel circling a market that is doubling nearly overnight, the only question left i
Google TPU v8 vs Nvidia: How Inference Is Rewriting the AI Market
In April, Google announced it would begin selling its TPUs to select third-party data center operators, which is something the market has anticipated for nearly a decade. The TPU-versus-Nvidia-GPU deb
The AI Networking Stock That Beat Nvidia by 7X YTD for Returns of 135% YTD
AI networking stock Lumentum is among the key I/O Fund winners in 2026. We allocated heavily to LITE in January—a month before Nvidia backed the company. While most investors couldn’t stomach taking a

Bloom Energy — Our 2026 Top Pick Was the Best Performing Stock in April
April was the best month in six years for the Nasdaq-100. The single best-performing large-cap stock wasn't Nvidia, Microsoft, or Meta. It was Bloom Energy, up roughly 109% in one month. As you'll rec

Inside Nvidia’s $4B Optical Strategy—and Why CPO Changes Everything
Within the AI investment theme, there is nowhere that the supply chain shifts faster than in networking, leading companies to gain content on new platforms or lose incremental share. The reason is str

Is Nvidia Stock a Buy? Why Semiconductor Strength May Signal a Market Top
In this report, we take a deeper look at the technical scenarios, which suggests that Nvidia’s latest high is shaping up to be a potential bull trap. That view is corroborated by the broader semicondu

Nvidia’s $20 Trillion Thesis Is Intact. My 2026 Allocation Isn't
The thesis on Nvidia's hardware moat has played out exceptionally well, but that also highlights one of the biggest risks investors face, which is becoming emotionally attached to a winning stock. Whi
