Solar Stocks Still Searching For A Bottom
November 07, 2023

Beth Kindig
Lead Tech Analyst
This article was originally published on Forbes on Nov 3, 2023,01:00am EDT
Solar is arguably one of the market’s most sold-off industries at the moment, with the Invesco Solar ETF falling more than 42% YTD as the industry struggles to find growth in a high-rate environment. With implied Fed funds futures suggesting interest rates will remain above 5% through Q2 2024 before slowly dropping to the 3.75% range by year-end 2025, the industry is still facing a high-rate environment with more possible adverse demand effects for multiple quarters ahead.
SolarEdge and Enphase are among the S&P 500’s worst performers this year, falling more than 70% each; a significant weakening in US demand starting in Q2 worsened with weakening European demand in Q3, causing revenues to nosedive. Residential solar companies SunPower, Sunrun, and Maxeon have all declined more than 55% to 70%, as well.
SolarEdge Says Weak EU Demand Caused Q3 Revenue Slump
SolarEdge sent the solar sector for a tumble on October 20th as it pointed to significant weakening in EU demand for a major Q3 shortfall and lower Q4 revenues. Shares fell over -27% as the company cut its revenue guide nearly (20%) from $880M-$920M to $720M-$730M, its gross margin forecast from 28%-31% to 20.1%-21.1%, and its operating margin forecast from $115M-$135M to $12M-$31M. CEO Zvi Lando said the company “experienced substantial unexpected cancellations and pushouts of existing backlog from our European distributors” in the second half of Q3, while installation rates “were much slower at the end of the summer and in September.”
Q3 results reported on Wednesday showed a marginal beat in revenues to $725M, an 1190 bp contraction in gross margin, and a shift to negative EPS, but the focal point of the report was a brutal Q4 guide. Consensus estimates for Q4 heading into the report were floating between $660M to $675M – the actual guide was far lower, with SolarEdge pointing to $300M to $350M in total revenues, with $270M to $325M in solar revenues.
That correlates to a (55%) QoQ decline from Q3’s $725M, and (67%) lower than the nearly $1B in quarterly revenues SolarEdge generated in Q2. Non-GAAP gross margins are expected to decline another 1280 to 1580 bp from Q3’s 20.8% to just 5% to 8% in Q4, including a 130 bp benefit from IRA credits. Given the operating expense outlook and major gross margin contraction, SolarEdge could see Q4 non-GAAP EPS fall further from the ($0.55) reported in Q3 to ($2.40) or lower in Q3 — not even in the same universe at the $0.63 consensus estimate.
Sign up for I/O Fund's free newsletter with gains of up to 221% - Click here
Enphase Earnings Echo Demand Woes
Enphase echoed SolarEdge’s commentary about weakening EU demand, as European revenues fell (34%) sequentially in Q3, after recording +25% QoQ growth in Q2. That’s a pretty swift QoQ decline in European revenues, which Enphase attributed to “high inventory at our distribution partners along with a softening in demand in our key markets – the Netherlands, France, and Germany.”
US revenues fell (16%) sequentially in Q3, continuing a (12%) sequential decline in Q2 as high rates and the shift to NEM 3.0 continued to impact US demand. Management said that in California, the “sell-through of our microinverters was 25% lesser in Q3 compared to Q2 due to the NEM 3.0 transition. It will take a few more quarters for our installers to fully transition to NEM 3.0 and normalize sales to NEM 2.0 levels.”
For Enphase, US revenues have been declining, and Europe’s stronger growth is not enough to absorb the losses in the US; now, that picture is even clearer: California is set to drag on US growth until NEM 3.0’s normalization completes sometime in 2024, while European demand has weakened substantially. Combined, this is causing a snowballing decline in revenues that may not bottom until Q1 or even Q2 2024, one to two quarters later than previously expected.
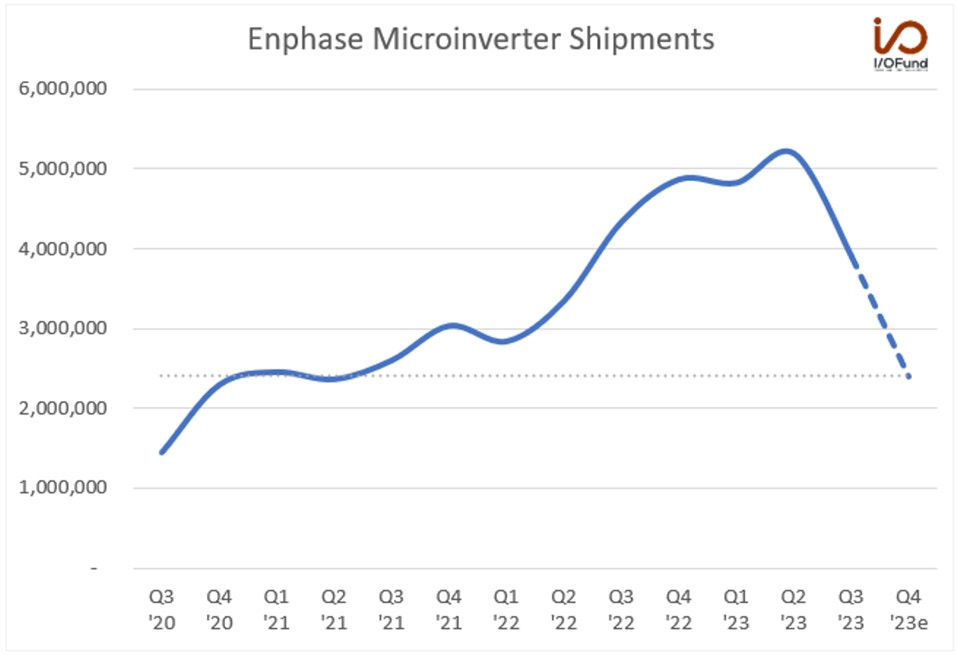
Enphase guided a nearly (40%) QoQ revenue decline for Q4: $300M to $350M, compared to $551M in Q3 and $711M in Q2. Management provided some clarity on the very low Q4 guide, saying it “reflects approximately $150M of channel inventory correction in the U.S. and Europe. In other words, we are under shipping to the end market demand for our products by approximately $150M. We anticipate under shipment will continue in Q1 and expect our channel inventory to normalize in Q2.”
That raises some doubts about when microinverter shipments will bottom, as shipments are plummeting, falling (24.9%) sequentially from more than 5.1M in Q2 to just over 3.9M in Q3. Q4’s revenue guide suggests microinverter shipments could fall by ~1.5M QoQ to ~2.4M, or the lowest level since Q2 2021.

Source: I/O FUND
A quick V-shaped recovery in early 2024 for microinverter shipments and revenues looks to be out of the picture, based on management’s commentary around inventories and California’s normalization trend. In addition, US residential installations are projected to decline next year, while demand in the Netherlands may have peaked last year and fall through 2025 to 2026.
US Residential Growth Forecast to Decline In 2024
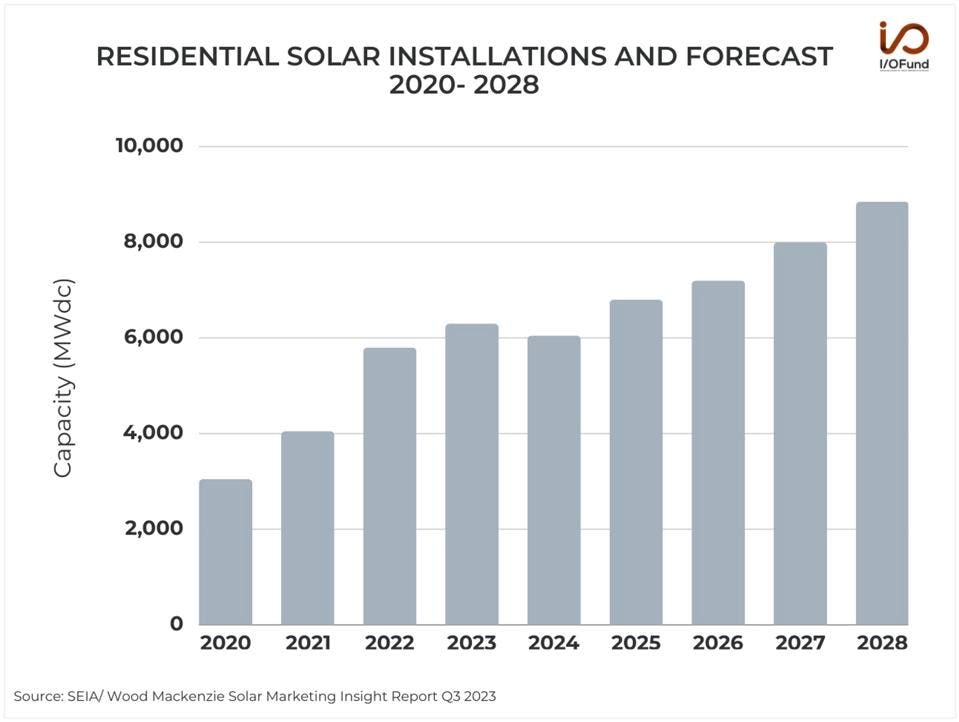
The near-term outlook for solar has definitely taken a hit from high rates impacting demand – a forecast from Wood Mackenzie/SEIA is pointing to a YoY decline in US residential solar installations in 2024, weighed down by a sharp contraction in California. Overall, the group expects installations to drop (4%) in 2024, dragged down by a (38%) contraction in California primarily due to the shift to NEM 3.0.
Q2 recorded growth of +6% QoQ and +30% YoY to 1.77 GW installed, reaching a new record. However, SEIA noted that “growth has not been as strong in traditionally larger markets with lower retail rates like Arizona and Texas, where high interest rates are creating headwinds.” That interest rate headwind has persisted through Q3, into Q4, and most likely will cause demand softening through much of 2024. Combined with a “lower urgency to go solar due to the ITC extension” and heightened recession fears, the broader macro backdrop for solar remains muddled, reflected by Enphase’s and SolarEdge’s troublesome revenue guides.

Source: SEIA / WOOD MACKENZIE SOLAR MARKETING INSIGHT REPORT Q3 2023
The long-term outlook for residential is more positive, as growth is expected to pick back up to about +8% on average from 2025 through 2028, boosted by IRA benefits and more projects qualifying for ITC adders. However, that inflection back to growth in 2025 is not set in stone and may not occur as quickly as anticipated, should rates remain at or above 4% heading into the first half of the year.
Every Thursday at 4:30 pm Eastern, the I/O Fund team holds a webinar for premium members to discuss how to navigate the broad market, as well as various stock entries and exits. We offer trade alerts plus an automated hedging signal. The I/O Fund team is one of the only audited portfolios available to individual investors. Learn more here.
EU Key Market Demand at Risk in the Near-Term
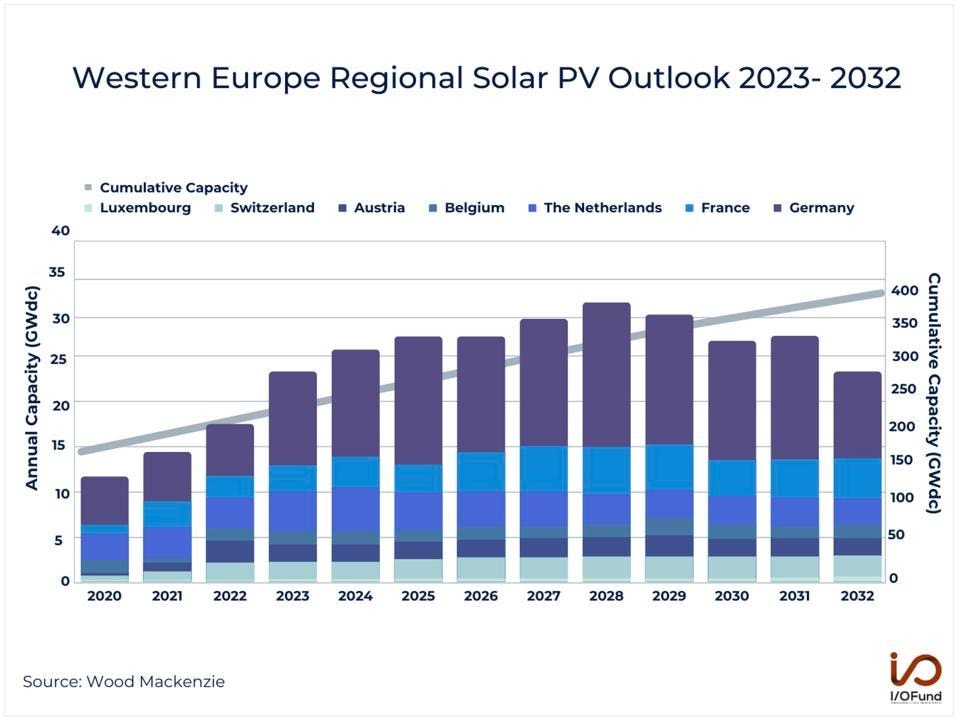
SolarEdge cited weakening demand across the EU, while Enphase pointed out softened demand in three key markets: the Netherlands, France, and Germany. These three markets are expected to account for a lion’s share of annual capacity in Western Europe over the next decade, so softening demand in the three nations is not something to be taken lightly.

Source: WOOD MACKENZIE
In the Netherlands, annual installed capacity is forecast to have peaked in 2022 to about 1.8 GW. A further decline from the peak is projected to occur in 2024 before stabilizing around 1.4 GW per year, nearly (22%) lower than 2022’s levels. This decline to stagnation in capacity installed would be a stark contrast to the strong growth seen from 2018 through 2022.
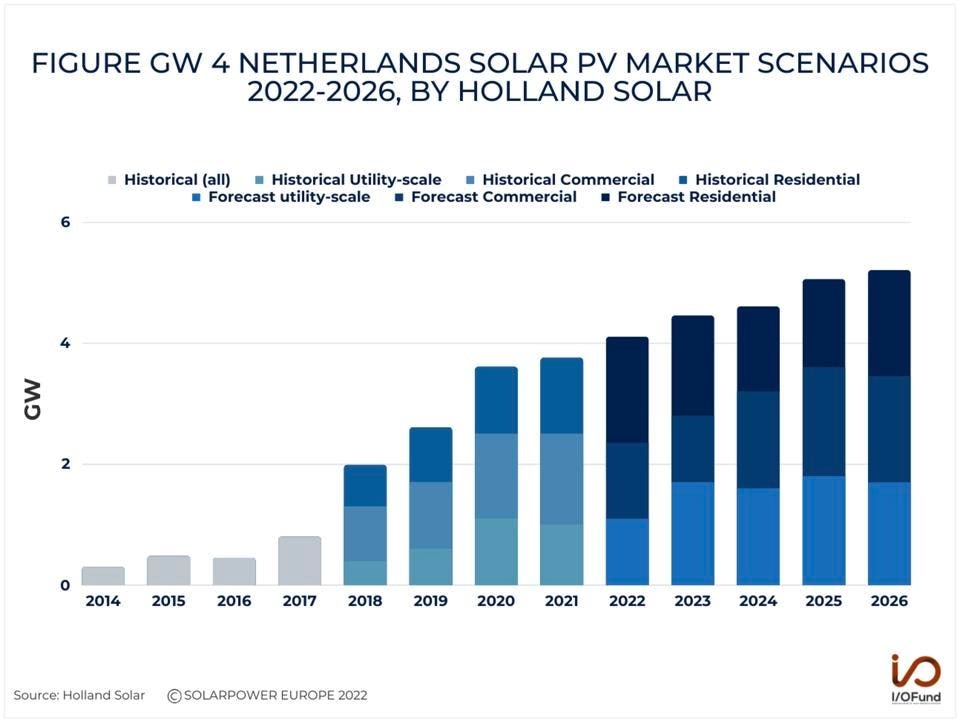
Source: HOLLAND SOLAR
Germany is also seeing some near-term effects to solar demand, although its medium-term and long-term view remains brighter than that of the Netherlands. Germany saw 3.4 GW of solar capacity installed in Q3, a (5.5%) sequential decline from 3.6 GW in Q2 as rooftop solar installations pulled back. September’s installed capacity was just 0.92 GW, a (32%) decline from July’s 1.35 GW additions and the lowest monthly level since February. While this slump in installations is likely to continue through Q4 and possibly extend into 2024, residential’s outlook over the decade is strong: Wood Mackenzie sees Germany’s “residential segment will experience the most growth, with cumulative installed capacity expected to grow fivefold” through 2032.
France witnessed 12% growth in installed capacity in the first half of 2023, with total installed capacity of 1.37 GW. Nearly 42% of the installed capacity in 1H came from fully or partially self-consumed systems, while 94% of installations in Q2 were systems smaller than 9 kW, suggesting the residential market had been relatively robust heading into 2H. Over the long-run, France is expected to see residential solar installations climb, with projections for “cumulative totals for home solar in France to quadruple by 2032.”
Valuations at Multi-Year Lows
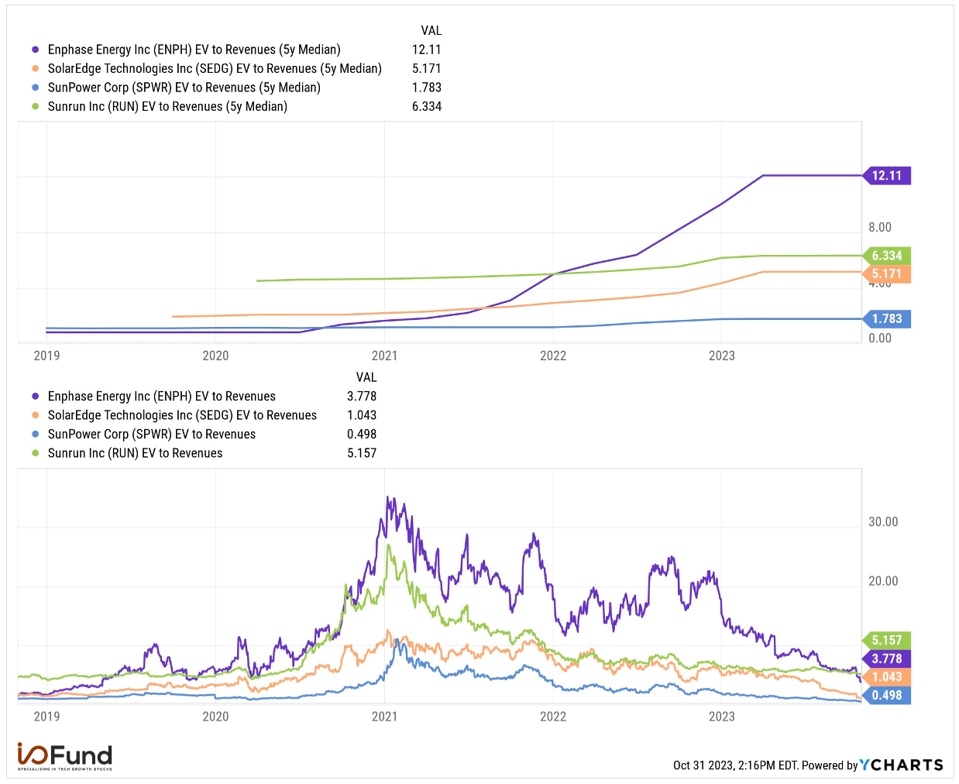
Residential solar stocks have seen valuations drop to multi-year lows. Enphase currently trades at 3.77x EV/revenue and 4.4x forward EV/revenue, far below its 5-year median 12.11x multiple and far below the high double-digit multiples it commanded in 2021 and late 2022. SolarEdge’s 1.04x EV/revenue and 1.15x forward EV/revenue also sit far below its 5-year median multiple of 5.17x. Forward P/E ratios for the two have dropped to the teens, nearly 70% lower than their 5-year averages, respectively.

Source: I/O FUND
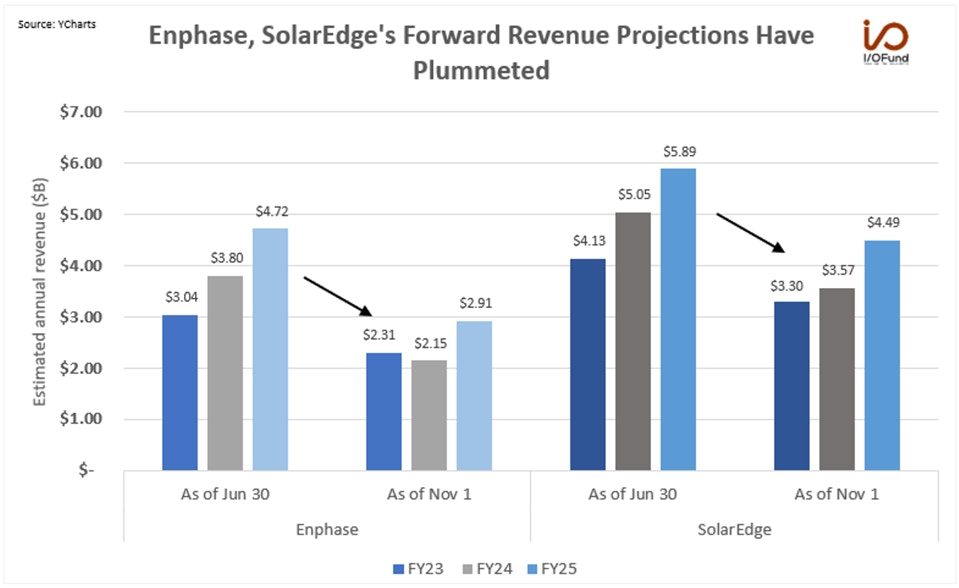
However, forward revenue projections have pulled back substantially – revenue targets have essentially shifted back by one to two fiscal years.

Source: YCHARTS
As of June 30, Enphase was projected to generate revenues of $3.04B in FY23, before growing to $3.80B in FY24 and $4.72B in FY25. As of October 30, just 4 months later, Enphase’s forward revenue forecast has plunged around (40%): FY24’s forecast has declined by more than $1.6B to just $2.15B, below FY23’s projected $2.3B, while FY25’s forecast has pulled back $1.8B to below $3B– a figure that Enphase was previously expected to hit this year.
SolarEdge was projected to see similar growth, with revenues rising from $4.13B in FY23 to $5.05B in FY24 and $5.89B in FY25. Again, forward projections have pulled back significantly, with FY24’s estimate now just $3.74B, around (26%) lower than it had been on June 30.
Near-term demand weakness in multiple major end markets is the main theme for solar stocks heading into 2024. Forward revenue projections have plummeted as a result, while valuations have reached multi-year lows – Enphase and SolarEdge are trading at deep discounts in anticipation of a bottom in revenues occurring over the next two to three quarters.
By respecting our risk management, the I/O Fund closed Enphase twice with minimal losses. When the fundamental picture changed, we stepped aside. If there is any lesson 2022 has taught tech investors, it’s that long-term buy and hold can create unnecessary losses. In April, we closed Enphase for a (-15%) loss following an earnings analysis for our premium members, avoiding a (-64%) loss from the original cost basis. When we attempted again in September, we closed the position when the setup failed, avoiding the losses from the solar sector selloff and Enphase’s most recent report. We share our trades in real time with our research members.
I/O Fund Equity Analyst Damien Robbins contributed to this report.
Please note: The I/O Fund conducts research and draws conclusions for the Fund’s positions. We then share that information with our readers. This is not a guarantee of a stock’s performance. Please consult your personal financial advisor before buying any stock in the companies mentioned in this analysis.
Recommended Reading:


More To Explore
Newsletter

Nvidia, CXL, and the Battle to Improve AI Inference Economics
This is Part 2 of our two-part series on AI inference economics. In Part 1 — Why Nvidia's Next AI Battle Is About Tokens per Watt, we laid out why tokens per watt has become the defining metric for in

Why Nvidia’s Next AI Battle Is About Tokens per Watt
As hyperscalers move from building AI infrastructure to monetizing it, tokens per watt helps to reflect if revenue is scaling and if profitability is improving. Offload engines can increase tokens per

Micron Is Up 900%. Here’s Why the AI Memory Trade May Still Have Room to Run
Over the past 10 months, memory chip stocks have gone from being solid beneficiaries of the AI boom to capturing a massively outsized piece of the return pie. The inflection in Micron’s performance de
Why the S&P 500 Shrugged Off the Iran War — and What Could Finally Break the Rally
On February 28th, the U.S. went to war with Iran, and the market was handed the kind of shock it hasn't contended with for years. The conflict set off a chain reaction across the region: an ongoing su
Nvidia, CoreWeave, and Nebius: Inside the Circular Financing of the GPU Boom
Neoclouds are one of the more hotly debated AI business models, with CoreWeave and Nebius being the two most widely recognized names. These companies have seen their sales, backlog, and share prices s
AMD, Nvidia, Arm, Intel: Inside the $120 Billion CPU Gold Rush
CPUs have gone from an afterthought to becoming the AI trade’s next great bottleneck – and with AMD, Nvidia, Arm and Intel circling a market that is doubling nearly overnight, the only question left i

Google TPU v8 vs Nvidia: How Inference Is Rewriting the AI Market
In April, Google announced it would begin selling its TPUs to select third-party data center operators, which is something the market has anticipated for nearly a decade. The TPU-versus-Nvidia-GPU deb

The AI Networking Stock That Beat Nvidia by 7X YTD for Returns of 135% YTD
AI networking stock Lumentum is among the key I/O Fund winners in 2026. We allocated heavily to LITE in January—a month before Nvidia backed the company. While most investors couldn’t stomach taking a

Bloom Energy — Our 2026 Top Pick Was the Best Performing Stock in April
April was the best month in six years for the Nasdaq-100. The single best-performing large-cap stock wasn't Nvidia, Microsoft, or Meta. It was Bloom Energy, up roughly 109% in one month. As you'll rec

Inside Nvidia’s $4B Optical Strategy—and Why CPO Changes Everything
Within the AI investment theme, there is nowhere that the supply chain shifts faster than in networking, leading companies to gain content on new platforms or lose incremental share. The reason is str
