Top 3 Ad-Tech Stocks For 2024
March 18, 2024

Beth Kindig
Lead Tech Analyst
This article was originally published on Forbes on Mar 14, 2024,07:01pm EDT
Ad spending growth is widely forecast to accelerate in 2024, after a challenging macro environment significantly dented budgets and growth in 2023. The US advertising market is already showing positive signs of growth, starting off 2024 with a 4.3% YoY increase in January, the strongest January on record and a tenth straight monthly increase.
We’re tracking ad-tech at the moment for three key reasons: a robust ad market backdrop with multiple major event tailwinds, strong cash flow generation, and improvements in operating leverage. We’ve previously covered the 2024 outlook for four major digital advertising verticals in our analysis “Ad Spending Growth to Accelerate In 2024” at the end of December; now, we take a look at three of the advertising industry’s top stocks: Meta, The Trade Desk, and Alphabet.
Meta: The Juggernaut Has Returned
The Juggernaut is back — Meta has been the second-best performing stock of the Magnificent 7, with its 44% return since the end of 2021 and a 301% return since the end of 2022 beaten only by Nvidia. This rally has been supported by significant improvements in operating leverage as revenue growth has reaccelerated to the mid-20% range.
Meta has stood out amongst social media peers for its strong growth in ad impressions, a recovery in ad pricing, and its ability to generate strong cash flows while still spending tens of billions on R&D. We’ve tracked Meta’s strong ARPU acceleration, but the more impressive (and arguably more important) story for Meta is how this translates into a substantial degree of operating leverage.
Meta’s operating margin expanded over twenty percentage points YoY to 40.8% in Q4, returning to a margin not seen since Q1 and Q2 2021. FY23 operating margin improved 990 bp YoY to 34.7%, with room for improvement in FY24. This is helping drive a strong improvement in the bottom line, with Meta reporting a net margin of 34.9%, a second straight quarter above 33% and a strong 2040 bp YoY expansion. Improvement from the 2022 bottom in fundamentals is easily visible in the chart below.

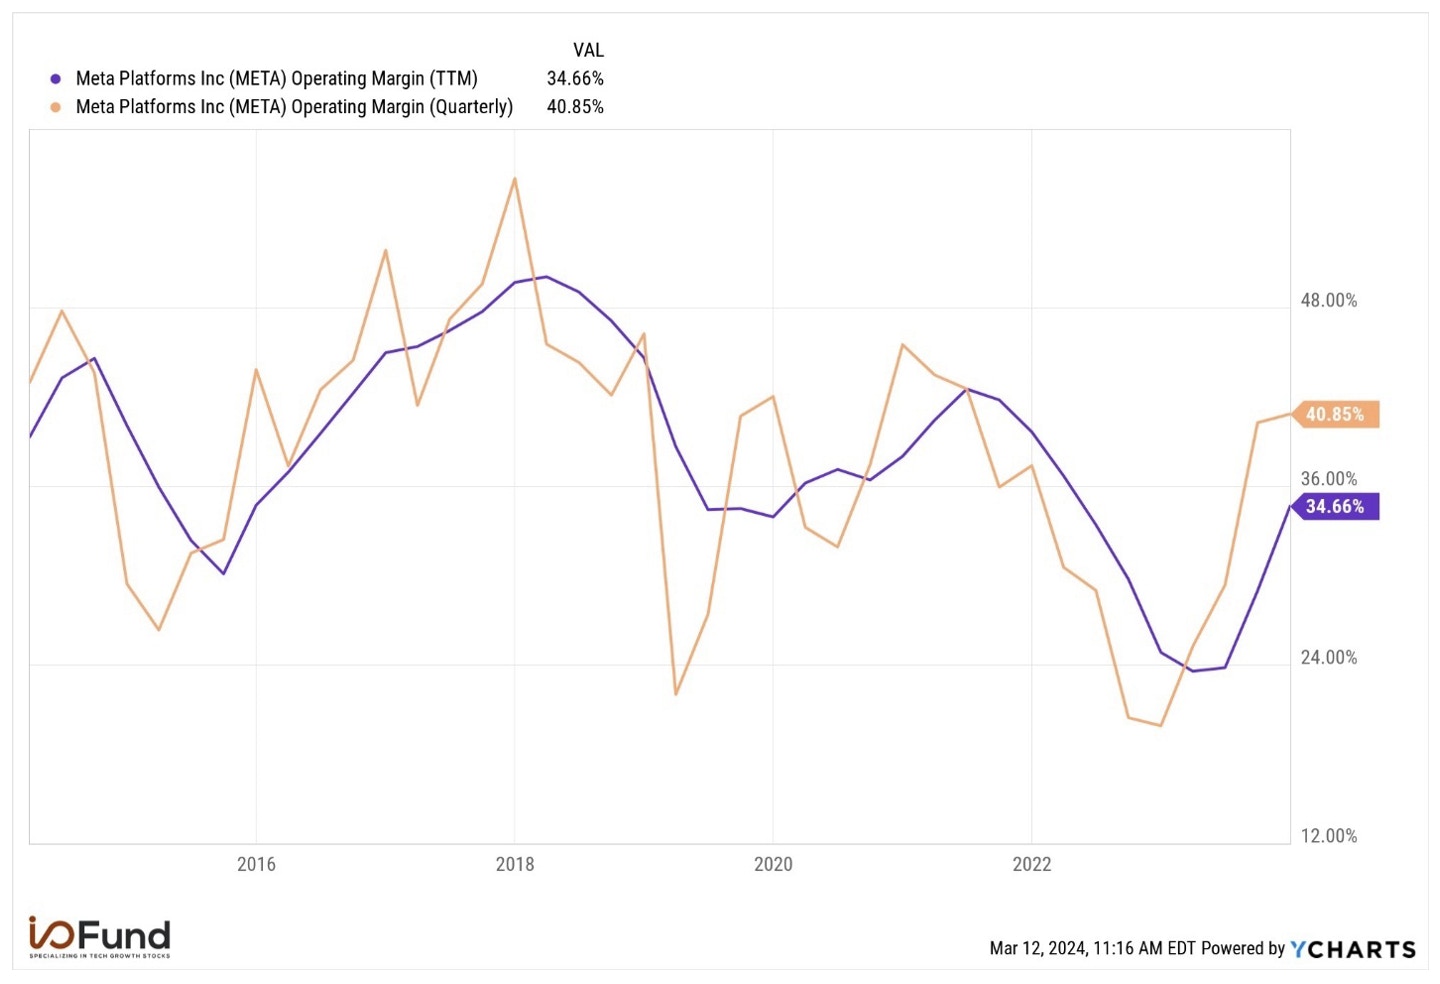
Source: YCharts
The rebound in leverage comes despite Meta pouring tens of billions into Reality Labs – operating loss for Reality Labs totaled ($16.1) billion for FY23, or a massive ~1195 bp headwind to operating margin.
Sign up for I/O Fund's free newsletter with gains of up to 221% - Click here
Meta’s Momentum to Continue in 2024
Meta’s momentum with strong revenue growth is expected to continue in 2024, supported by ARPU trends. In addition, the implementation of AI features, a favorable ad market backdrop, and improving operating leverage supports substantial EPS growth this year.
Meta guided for a very strong Q1, calling for 24.8% YoY growth, a third straight quarter with growth >20%, though it comes against a weak 2.6% YoY comp. Accelerating ARPU in Facebook’s two core geographies, the US/Canada and Europe, supports this revenue growth story.

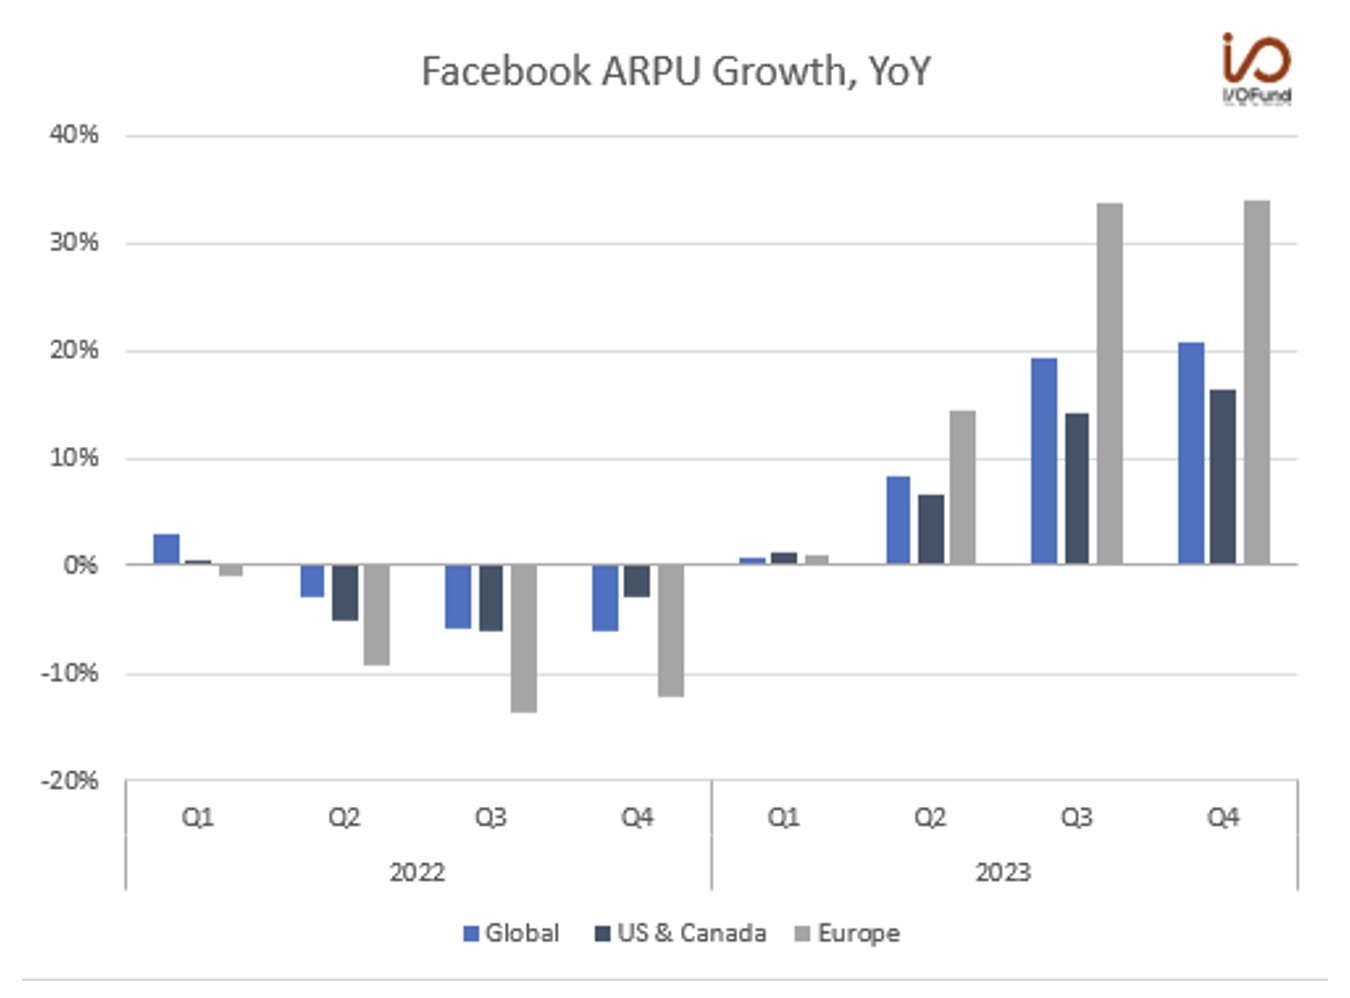
Source: Meta
Also supporting the growth story is a favorable social media ad spend backdrop, as well as major political and sporting events, namely the US presidential election in November and the Summer Olympics. Globally, social media ad spend has one of the fastest projected growth rates in the ad industry at +13.8%.
In the US, growth is expected at a similar rate, with Insider Intelligence projecting 13.5% YoY growth to $82.9 billion. This represents a $7.8 billion increase from their Q1 2023 forecast, with the market benefiting from “higher ad loads, a focus on lower-funnel ads, and an improved advertising economy,” driven by both Meta and TikTok.
For 2024, key metrics are supporting a return to >40% operating margin for the full year and a possible >33% net margin, driven by increasing ad pricing, strong engagement trends and impressions growth, aided by the release of numerous AI features. Reaching those margins for the full year would imply EPS growth of nearly 38% to $20.50 on $160B in revenue. Meta would be trading at a 24x forward PE ratio under that EPS growth assumption, 15% cheaper than its 5-year average PE of 27x; however, this is the peak multiple we’ve seen so far in Meta’s rally.
The Trade Desk: CTV Tailwinds Offer Growth Outlet
The Trade Desk, which offers a cloud-based digital advertising purchasing and optimization platform for advertisers across many mediums, from CTV to display, audio, digital out-of-home, and more, continues to be one of the fastest growing ad-tech stocks in the industry. Revenue grew 23% in FY23 to $1.95 billion, outpacing a tepid ad market but representing a 9 percentage point deceleration from 32% revenue growth in FY22.
Though revenue has decelerated, profitability has remained solid, and GAAP net income more than tripled YoY to a nearly 10% margin this year, though that is much lower than historical levels. Operating income is showing signs of stability and improvement on a TTM basis, after periods of volatility in 2021 and 2022.

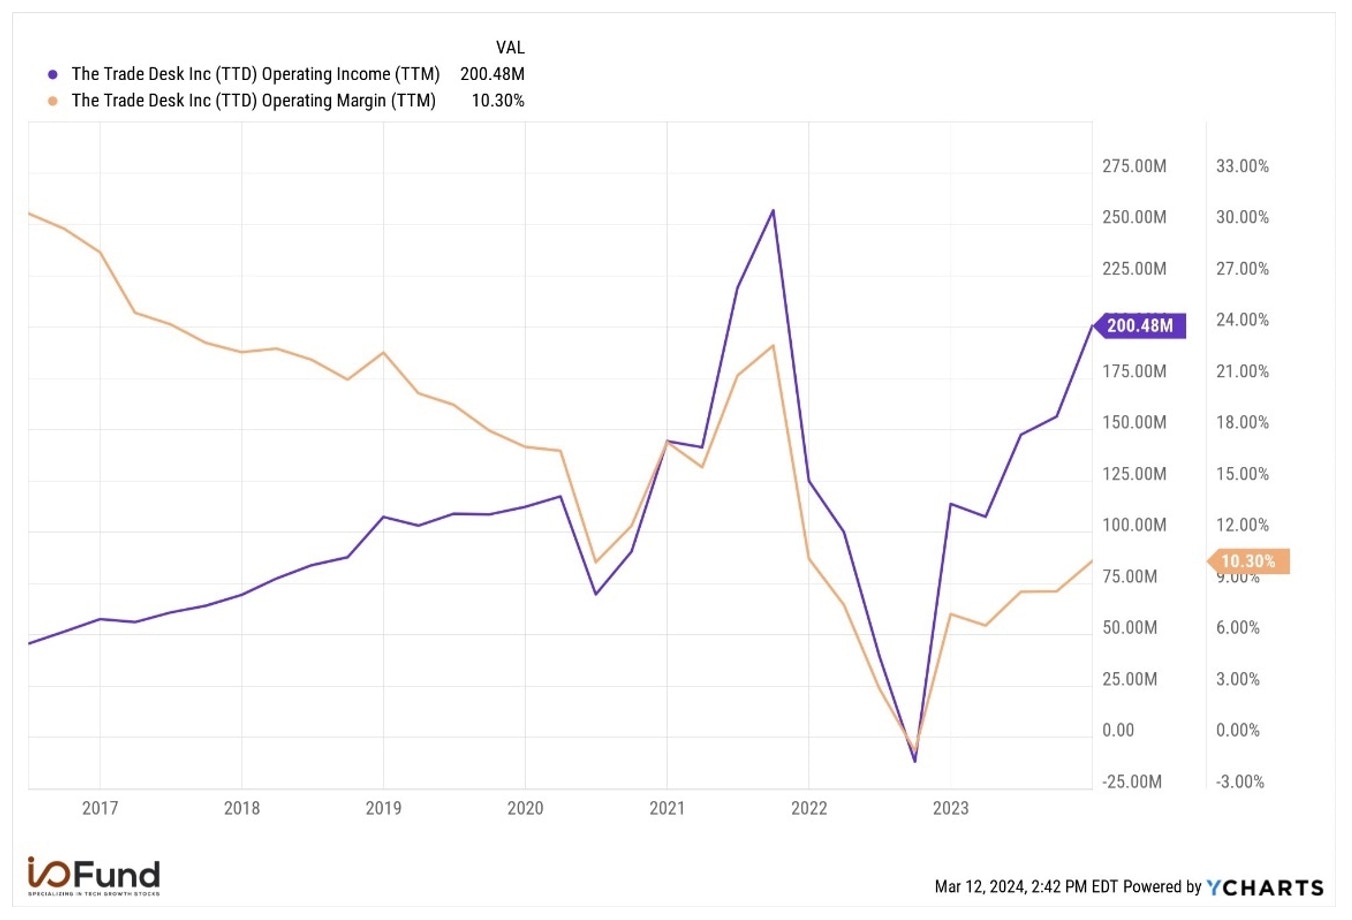
The Trade Desk's operating income has quadrupled from $50 million in early 2017 to $200 million in2023 despite a deterioration in operating margin. Source: YCharts
Despite a steady deterioration in TTM operating margin over the past six years, from the 30% range to the 10% range in FY23 (after briefly dipping negative), operating income has grown, in fact it has quadrupled from $50 million in early 2017 to $200 million in 2023.
The challenge now for The Trade Desk is maintaining this more rapid trajectory in operating income growth through 2024 and into 2025 given that revenue growth is expected to decelerate. This will be critical in driving expansion in GAAP net margin, which hovers just below 10% currently, compared to above 15% as it had maintained for more than three years.

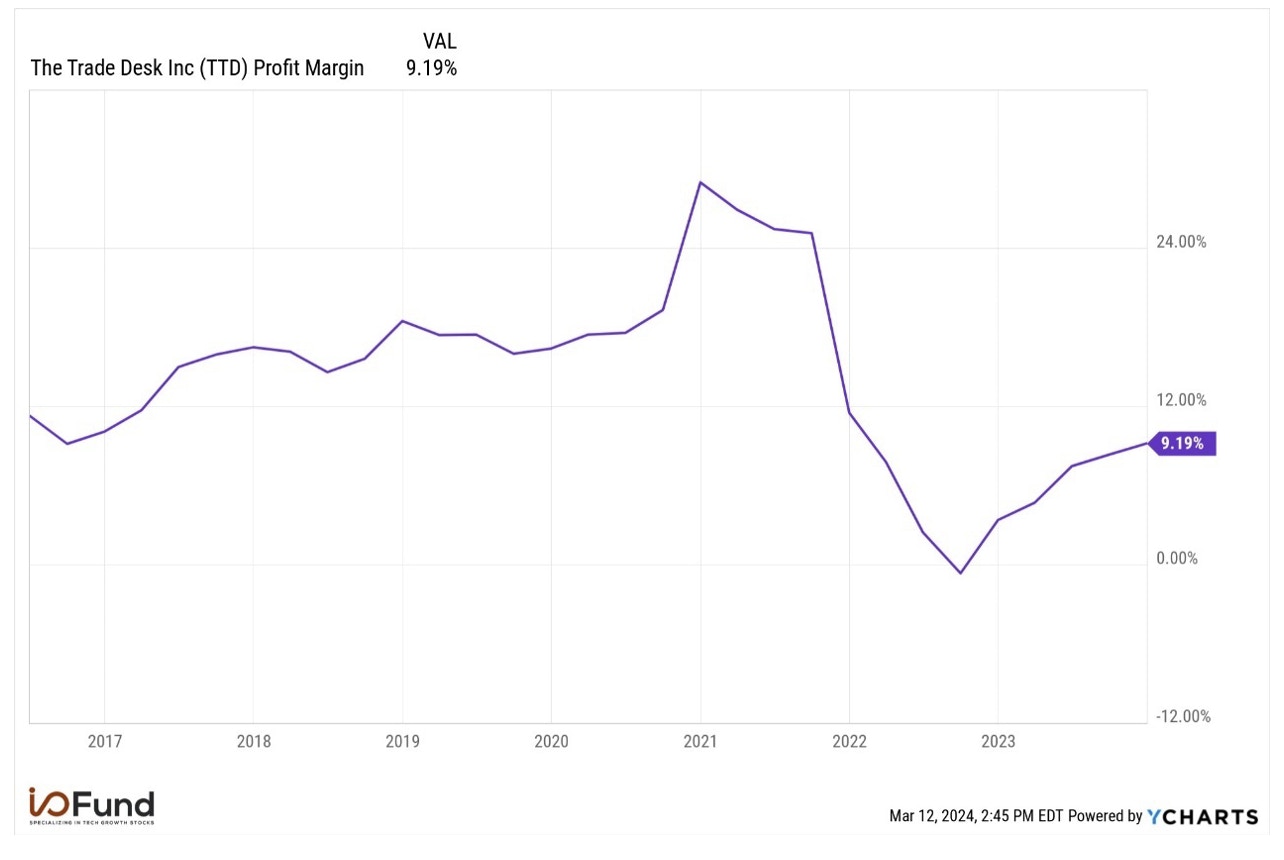
The Trade Desk's net profit margin hovers just below 10% currently, compared to above 15% as it had maintained for more than three years. Source: YCharts
Every Thursday at 4:30 pm Eastern, the I/O Fund team holds a webinar for premium members to discuss how to navigate the broad market, as well as various stock entries and exits. We offer trade alerts plus an automated hedging signal. The I/O Fund team is one of the only audited portfolios available to individual investors. Learn more here.
CTV, Kokai Provide Growth Opportunities in 2024
CTV ad spend and the ramp of The Trade Desk’s new AI-powered buying platform Kokai offer two potential growth outlets for 2024.
CTV ad spend is forecast to be digital advertising’s fastest growing channel this year, with Dentsu placing growth at 30.8%, while BIA is expecting growth as high as 39.5%. CTV ad spend in total has surged 400% since 2019, as use of streaming services soared through 2020 and 2021; now, rising adoption for major streamers’ ad-supported tiers beckons to bring more spend through CTV. This trend bodes well for The Trade Desk, as CTV “continues to be the fastest-growing channel at scale” for the company, as it sees that “ad supported streaming is going to be an essential strategy for any successful TV provider moving forward.”
Kokai, which launched in June 2023 as The Trade Desk’s AI-powered buying platform, has been labeled by CEO Jeff Green as the “largest platform overhaul” in its entire history. Kokai will be scaling throughout the year, and promises a new degree of optimization for ad buyers while providing KPIs throughout the entire funnel, instead of simply at the last click. In essence, The Trade Desk sees Kokai as an “upgrade in almost every way” to its existing platform.
Though determining the growth trajectory of Kokai over the next few quarters may be challenging, tracking gross spend and The Trade Desk’s take rate provides insights into revenue acceleration trends, and if Kokai and a strong CTV ad market are driving an acceleration in spend and improvements in take rate.

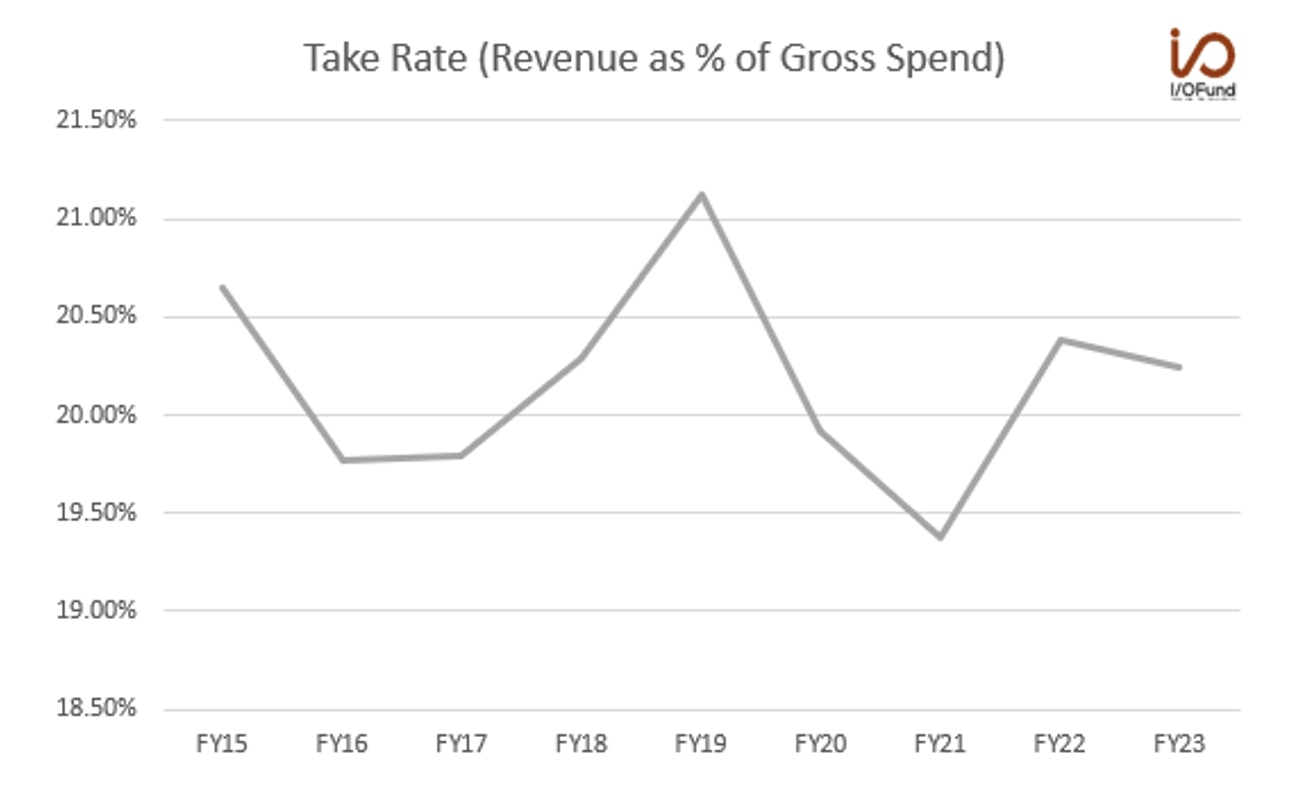
Source: The Trade Desk
The Trade Desk’s take rate has fluctuated between 19% and 21%, hovering around 20.3% in FY23. While it may seem obsolete to track a metric that fluctuates within a tight 200 bp range, the impact of a 100 bp change in take rate is actually quite large. Take FY21 as an example, when The Trade Desk recorded its lowest take rate at 19.4% — had this been 100 bp higher at 20.4%, revenue growth in the year would have been 700 bp higher, at 50% versus the 43% reported growth.
If gross spend can accelerate via a robust CTV market and Kokai’s improvements and efficiency gains for buyers, maintaining a take rate above 20% or driving growth to above 20.5% can help revenue growth accelerate to the high-20% range. However, the upcoming phase-out of cookies provides a significant risk to take rate, in that if The Trade Desk fails to get significant adoption of UID 2.0, which is the second most-used cookie replacement, it may struggle to command such a high take rate due to a loss of targeting ability in a cookie less digital environment.
Alphabet: Beneficiary of Search, CTV Ad Spend
Alphabet is a beneficiary of both search and CTV ad spend, and has seen growth accelerate this year as it works to integrate generative AI features and AI-based tools to drive improved ROI for advertisers – Alphabet recently reorganized its digital ad business to place more emphasis on generative AI and AI automated ads.
Alphabet reported $65.5 billion in advertising revenue, up 11% YoY, its first double-digit growth rate in six quarters, driven by strength in Search and YouTube. Alphabet has nearly doubled its quarterly run rate in just four years.

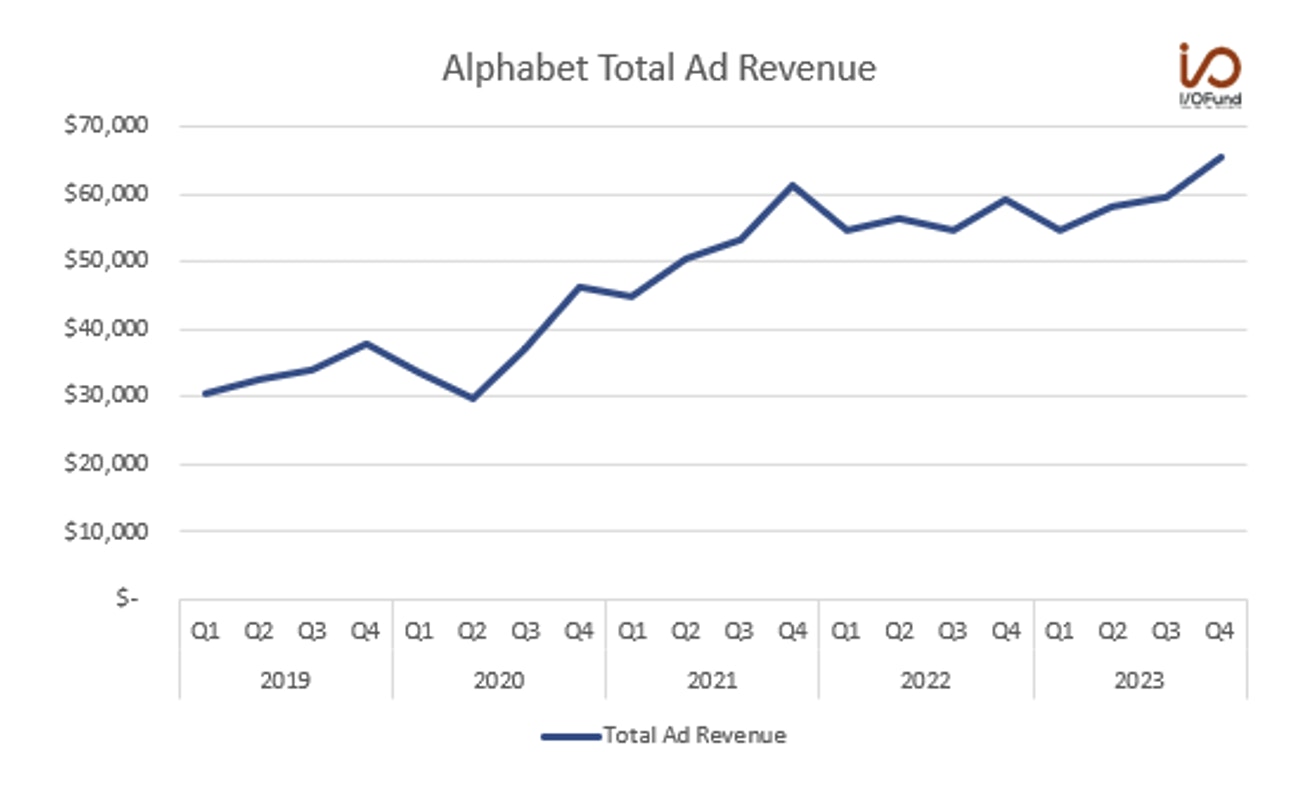
Source: Alphabet
Search and YouTube ad revenue growth accelerated in each quarter this year, from the low single-digits to 12.7% and 15.5% in Q4 respectively. What Alphabet is demonstrating is that AI-powered ad solutions are helping drive resilient Search ad revenue growth, at the same time that strong engagement metrics for YouTube Shorts (>2B MAUs, 70B daily views) and increasing watch times for YouTube TV are boosting YouTube’s ad revenue growth.

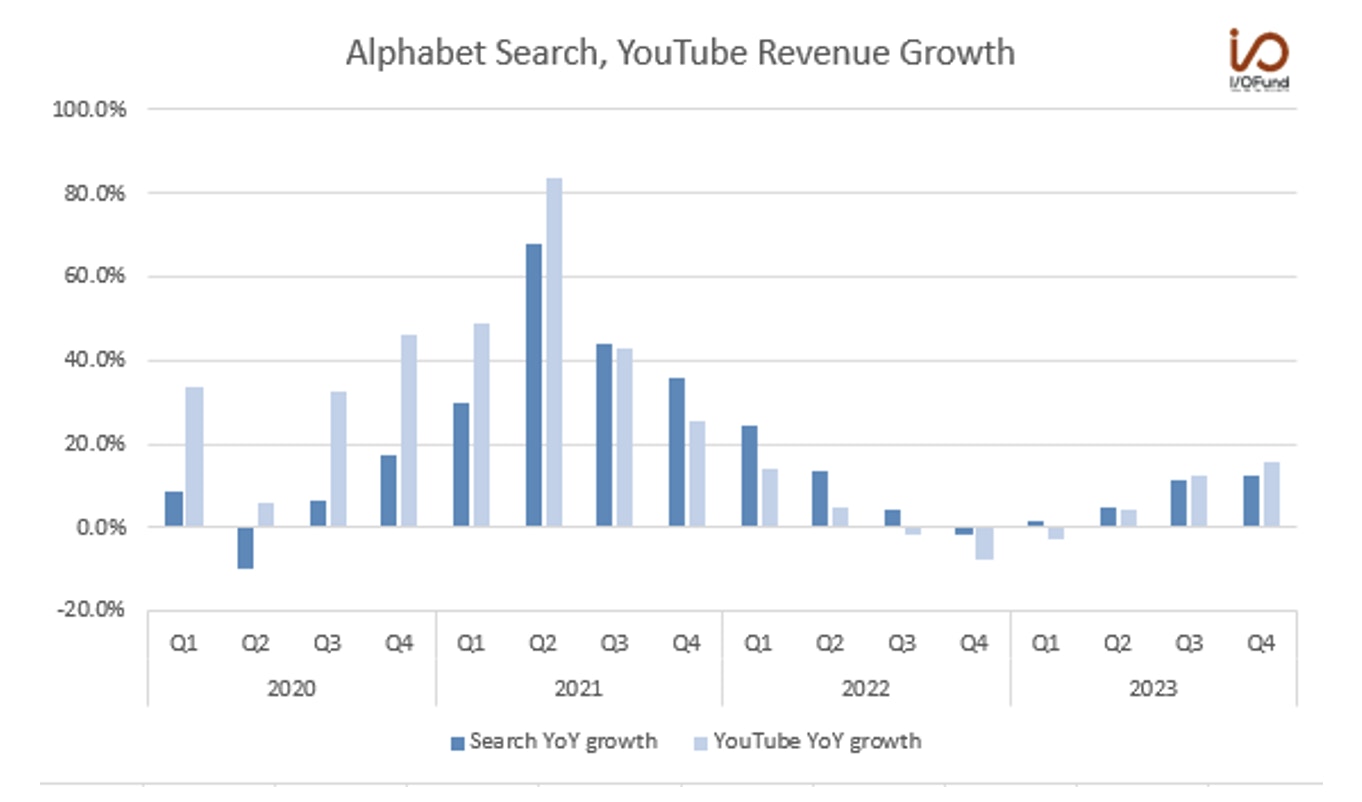
Source: Alphabet
AI Integrations Provide Opportunity for Growth
Alphabet is steadily making progress in integrating AI features in Search via Search Generative Experience (SGE) and in advertising campaigns via Performance Max (PMax). Executives have previously mentioned how these “AI-powered solutions like Search and PMax are helping retailers drive reliable, strong ROI and meet customers wherever they are across the funnel.” This is the value-add of SGE and PMax – driving CPM higher from via higher ROIs from improved targeting and optimization, while letting Alphabet toy with new ad placements and formats in Search pages. Alphabet sees “significant opportunities” to “actually deliver incredible ROI at scale” from these AI-powered features.
Alphabet’s Demand Gen is instrumental in driving long-term growth momentum across its more than 3 billion monthly active YouTube and Gmail users. Alphabet explains it as its “big bet to help social advertisers find and convert consumers via immersive, relevant, visual creatives” across these channels. Alphabet shared some color on Demand Gen in Q4, saying that “tens of thousands of advertisers are testing and, on average, seeing 6% more conversions per dollar versus image-only ads in Discovery campaigns.”
Gemini is also playing a more forward facing role in advertising products, powering Alphabet’s new conversational features in Google Ads. While it is still in beta in the US and UK, early tests have shown “advertisers are building higher-quality Search campaigns with less effort,” streamlining the campaign building process.
Cash is King
As the saying goes, cash is king, and Meta, Alphabet, and The Trade Desk stand out for strong cash flow generation metrics. Meta leads the Magnificent 7 with a nearly 53% operating cash flow margin, while The Trade Desk and Alphabet command OCF margins in the low-30% range.

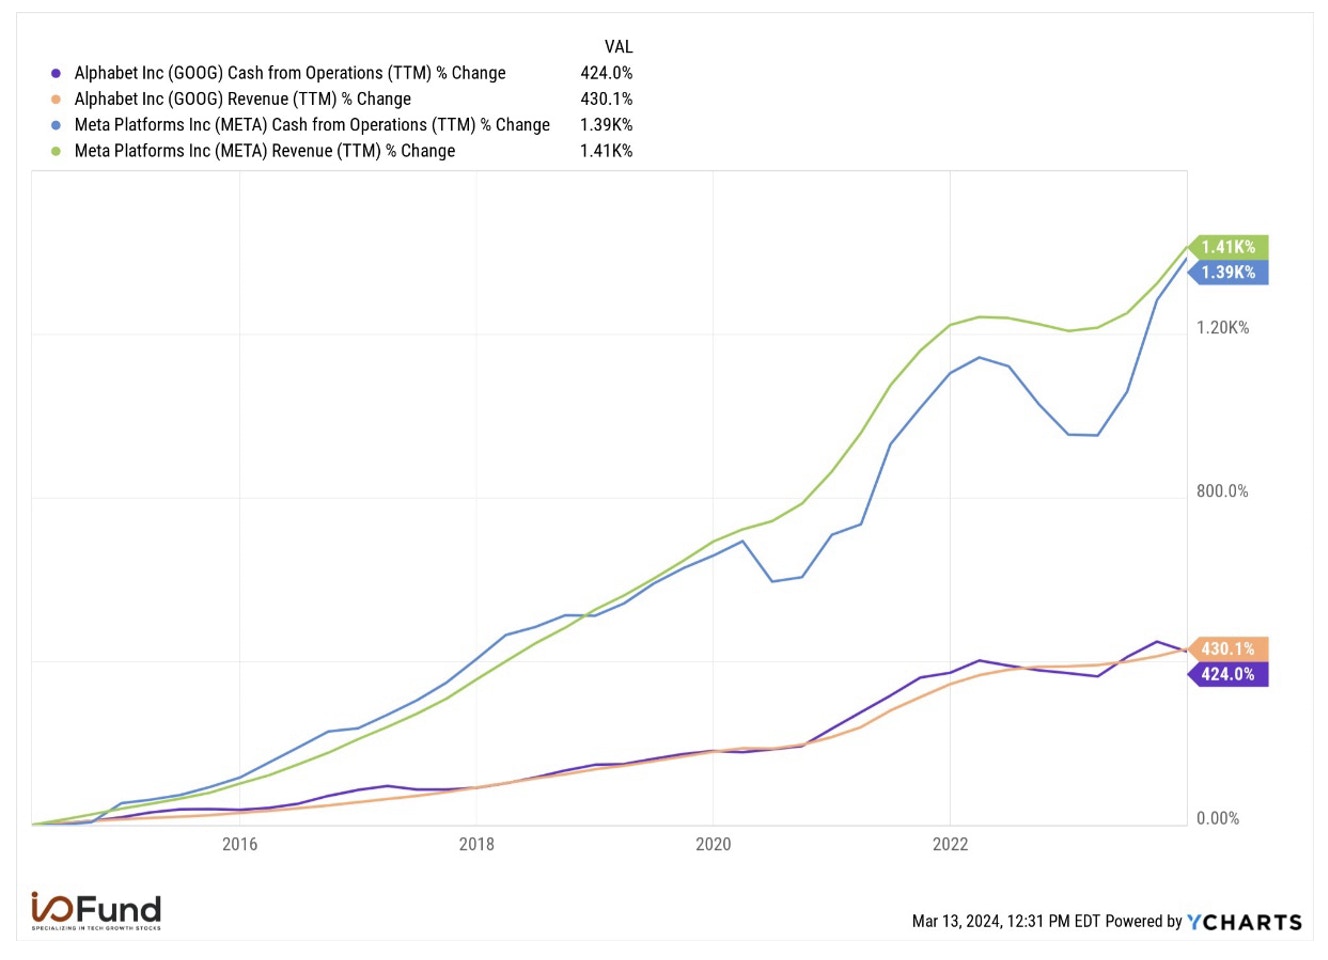
Source: YCharts
To put how strong this cash flow generation is in perspective, Meta and Alphabet have grown operating cash flow 1,400% and 425% respectively. This is incredibly impressive given the scale of the duo’s cash flows, with Meta generating $71 billion and Alphabet $101 billion.
Conclusion
Ad-tech stocks are on 2024’s watchlist for a few reasons: strong cash flow generation and growth, a positive ad-market backdrop buoyed by major political and sporting events, and implementation and integration of AI features to help drive improved ROI for advertisers. Meta, Alphabet and The Trade Desk look best positioned to capture and capitalize on the ad industry’s acceleration this year.
My firm is not buying these stocks at the moment as we believe we can get them lower than where they’re currently trading. Though Meta is trading lower than its 5-year average PE ratio, it’s at the peak level sustained so far during 2023’s rally, leaving less room for upside. On the top line, it trades at a 9.6 with 11 being the highest its traded since 2019 (the stock was valued at 11 during Covid when ad-tech was surging from high social media use). The 3-year median is 6.4 and the 5-year median is 8.3.
Alphabet is the cheapest of the Mag 7, trading at a 20x forward PE although EPS growth is expected to be more tepid at just 17% this year, versus 38% for Meta. The company is trading right at its 3-year median and 5-year median on a PS ratio. Some of the softer price action could be due to the anti-trust lawsuit which has closing arguments set for May.
The Trade Desk is more expensive than the two on the bottom line, trading at 123x forward earnings, although it is expected to deliver 82% growth to $0.66 in GAAP EPS. Its trading at it’s 3-year median and 5-year median with a PS ratio of 20.6.
Every Thursday at 4:30 pm Eastern, the I/O Fund team holds a webinar for premium members to discuss how to navigate the broad market, as well as various stock entries and exits. We offer trade alerts plus an automated hedging signal. The I/O Fund team is one of the only audited portfolios available to individual investors. Learn more here.
I/O Fund Equity Analyst Damien Robbins contributed to this report.
Please note: The I/O Fund conducts research and draws conclusions for the Fund’s positions. We then share that information with our readers. This is not a guarantee of a stock’s performance. Please consult your personal financial advisor before buying any stock in the companies mentioned in this analysis.
Recommended Reading:


More To Explore
Newsletter

Intel vs TSMC: How CoWoS Packaging Constraints Could Create an Opportunity for Intel Foundry
Taiwan Semiconductor (TSMC) is the single, most important company to the AI industry. However, to compete with the incumbent, Intel does not need to beat TSMC at leading-edge manufacturing. It only ne

Big Tech’s Free Cash Flow is Turning Negative – Who's Next?
Big Tech’s AI revenue is accelerating, but free cash flow is moving sharply in the opposite direction. Across Google, Microsoft, Meta and Amazon, capex is rising much faster than operating cash flow a

Big Tech Earnings Preview: Is AI Monetization Finally Catching Up to Capex?
The most pronounced difference between 2026’s tech rally compared to rallies in the past is which companies have been left out of it. The names most associated with the AI trade have hardly participat
Nvidia, CXL, and the Battle to Improve AI Inference Economics
This is Part 2 of our two-part series on AI inference economics. In Part 1 — Why Nvidia's Next AI Battle Is About Tokens per Watt, we laid out why tokens per watt has become the defining metric for in
Why Nvidia’s Next AI Battle Is About Tokens per Watt
As hyperscalers move from building AI infrastructure to monetizing it, tokens per watt helps to reflect if revenue is scaling and if profitability is improving. Offload engines can increase tokens per
Micron Is Up 900%. Here’s Why the AI Memory Trade May Still Have Room to Run
Over the past 10 months, memory chip stocks have gone from being solid beneficiaries of the AI boom to capturing a massively outsized piece of the return pie. The inflection in Micron’s performance de

Why the S&P 500 Shrugged Off the Iran War — and What Could Finally Break the Rally
On February 28th, the U.S. went to war with Iran, and the market was handed the kind of shock it hasn't contended with for years. The conflict set off a chain reaction across the region: an ongoing su

Nvidia, CoreWeave, and Nebius: Inside the Circular Financing of the GPU Boom
Neoclouds are one of the more hotly debated AI business models, with CoreWeave and Nebius being the two most widely recognized names. These companies have seen their sales, backlog, and share prices s

AMD, Nvidia, Arm, Intel: Inside the $120 Billion CPU Gold Rush
CPUs have gone from an afterthought to becoming the AI trade’s next great bottleneck – and with AMD, Nvidia, Arm and Intel circling a market that is doubling nearly overnight, the only question left i

Google TPU v8 vs Nvidia: How Inference Is Rewriting the AI Market
In April, Google announced it would begin selling its TPUs to select third-party data center operators, which is something the market has anticipated for nearly a decade. The TPU-versus-Nvidia-GPU deb
