
The world today was engineered to be ephemeral and noisy. This is a terrible combination for an investor.
On Twitter alone, there are 456,000 messages sent every minute. On Facebook, there are 510,000 comments posted every minute and 293,000 status updates. Outside of social media, there are 16 million text messages sent every minute and 156 million emails.
For an investor, the antidote to noise is quality stock analysis. Due diligence requires dozens of hours per equity, and it takes hundreds of hours every year to produce a free newsletter with quality analysis. I/O Fund strives to offer some of the team’s best analysis for free, and we believe the consistency and depth of what we provide for free is hard to replicate.
We offer this in the most challenging sector for investors, which is hands-down the tech sector. The tech sector is unusually challenging because it involves many different verticals – consumer, media, cloud, artificial intelligence, electric vehicles, and more. It’s also the highest risk and highest reward sector in the market. Due to sudden price movements in both directions, the stakes are high. Perhaps we are biased, but quality analysis particularly in the tech sector can be hard to come by.
Below are highlights from our free newsletter during the grueling year that was 2022. Due to the broad market being in the driver’s seat, our first few highlights review the free broad market analysis we published followed by a few strong fundamental calls.
For more information on our premium services, please click here.
Top Broad Market Highlights from I/O Fund’s Free Newsletter
The August to September Pullback:
Portfolio Manager, Knox Ridley, warned our free readers in August in the article, “Levels to Monitor in the Coming Pullback,” that the broad market failed to make a new low despite bad news and that a pullback was on the horizon. He also detailed why weakness in the bond market was coinciding with the pullback he was forecasting.
The analysis stated, “In last week’s broad market webinar, we warned our readers that a pullback was imminent. We also laid out what levels need to hold in order to confirm a new uptrend is forming. We also showed that the bond market is simply not buying what the equity market is, and that the USD pushing to new highs along with equities. These markets are simply not aligned with the current uptrend in equities, and until they are, we will remain cautious.”we warned our readers that a pullback was imminent. We also laid out what levels need to hold in order to confirm a new uptrend is forming. We also showed that the bond market is simply not buying what the equity market is, and that the USD pushing to new highs along with equities. These markets are simply not aligned with the current uptrend in equities, and until they are, we will remain cautious.”
Despite a level of exuberance in the markets following a bear market rally that formed in July, our analysis clearly stated now was not the time to buy – rather it was better to wait for the coming pullback: “These markets are warning investors that are paying attention to not get too excited, yet. No matter what scenario plays out, we do believe there will be a better opportunity to get aggressive on the long side.”
Note: For a Limited Time, I/O Fund is offering a $99/year Premium Newsletter plan that provides one actionable stock tip per month and analysis from a top performing, audited team. Click here for more detailsNote: For a Limited Time, I/O Fund is offering a $99/year Premium Newsletter plan that provides one actionable stock tip per month and analysis from a top performing, audited team. Click here for more detailsClick here for more details
Perhaps most importantly, to help with risk management, the analysis provided a long-term prediction for investors. The analysis stated: “No matter what scenario plays out, we expect around a ~10% pullback in the coming weeks, which should be followed by one more large push above SPX 4400 before the next leg lower begins.”
Carefully Timing the October Bottom:
Knox followed up with another article, “The Pullback is in Effect - Broad Market Levels - 08/26/2022”, to reiterate to our free newsletter readers that the pullback we have been warning about is in effect. The analysis provided two long term bullish scenarios. In the bullish scenario, we advised investors to buy on the second wave retrace, sometime in October.sometime in October.
Knox provided a macro update in September and discussed the key economic data points in the article “Broad Market Update: The FED versus Inflation.” The analysis points out how the FED team of experts completely missed the warning signs of data from The NAHB Index, The Case-Shiller Home Price Index, The Bloomberg Commodity Index, Crude Oil, and M2 Money Supply, pointing that inflation was a concern in 2021.
The analysis stated, “Despite the numerous market indicators pointing towards growing inflation pressures in September of 2021, the FOMC ignored the signs, and instead continue to press their loose monetary policies. They ultimately waited a year after inflation showed up to begin addressing it, putting them much farther behind the curve than investors are used to.” The aggressive increase in interest rates led to the worst stock market on record in nearly 50 years.
The analysis pointed out the similarities seen during 2021 and we hedged most of September last year to protect the portfolio from the downside risk with real-time alerts sent to members. Knox also provides regular macro updates to our premium members.
In October, the article "Divergences Point Toward Market Moving Higher" discussed how a bigger bounce was unfolding and this would take many investors off guard.
He stated: “I do believe many stocks and some markets have bottomed, and those are the ones that tend to lead going into the next uptrend […] In conclusion, we are seeing the types of extreme sentiment readings as well as divergences that mark a reversal. We are also seeing the market shrug off horrible inflation data. Since the PPI and CPI numbers came in hotter than expected, the market is up 6.5%. The last time we saw these patterns was in mid-June, just before the market moved up 18% in less than 2 months.”
Since then, we have seen a 3-month plus bounce where some stocks in our portfolio are up over 100% since we bought them around those lows. The I/O Fund portfolio manager put cash to work based on the analysis he provided at the free level. He also used more advanced analysis that he provides to our premium subscribers to help guide entries.
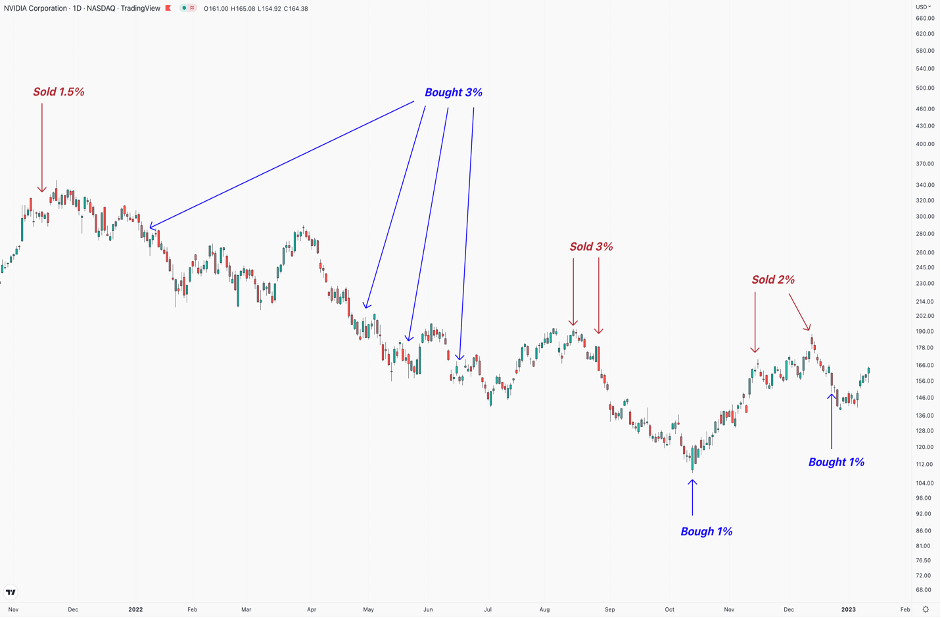
For example, after raising cash in mid-late August, on October 13th, we went on a buying spree within the first hour of the market open, while removing half of our hedge. We followed this up with various buys between October 14th, 18th, 21st, November 4th, 7th and 9th.
Every trade the I/O Fund makes is done through real-time trade alerts. Learn More.Every trade the I/O Fund makes is done through real-time trade alerts. Learn More.Learn More.
In detailing the October low, the I/O Fund free newsletter stressed the importance of tracking divergences.
The analysis pointed out, “We are seeing [divergences] now across bellwether stocks, varying sectors, and global markets. Many risk assets as well as global markets did not follow the S&P 500 (SPY) to new lows last week. Instead, they are signaling that a new push higher is likely to follow.”
This was partly determined by the fact transportation stocks, high beta, and small caps have been leading the markets since 2021, and when the S&P 500 made a new low, these markets made a new high. This was unique analysis that informed a critical turning point in the tough market of 2022.
Note: For a Limited Time, I/O Fund is offering a $99/year Premium Newsletter plan that provides one actionable stock tip per month and analysis from a top performing, audited team. Click here for more detailsNote: For a Limited Time, I/O Fund is offering a $99/year Premium Newsletter plan that provides one actionable stock tip per month and analysis from a top performing, audited team. Click here for more detailsClick here for more details
There’s more -- the above article was followed up with more evidence in the article - “The Bear Market Rally has Much Further to Go.” when Knox stressed that the market was ignoring the fact that small caps, financials, and industrials are in notable uptrends. Even within tech, there was new leadership developing and these new leaders tend to be stocks that outperform in new uptrends.
Knox talks about patterns of major indices like the Canadian S&P/TSX Composite Index, the Japanese Nikkei 225 Index, and the Australian S&P/ASX 200 Index. The Canadian Index has a history of leading the S&P 500 Index. He stated that if all the major global markets are moving in the same direction, you are in a very powerful trend. Knox also points to some of the key levels that he monitored to confirm an uptrend for the S&P 500 Index. He said three markets, namely the Canadian Index, the Japanese Index, and the Australian Index need one more move to go higher. This pattern is very bullish for equities.
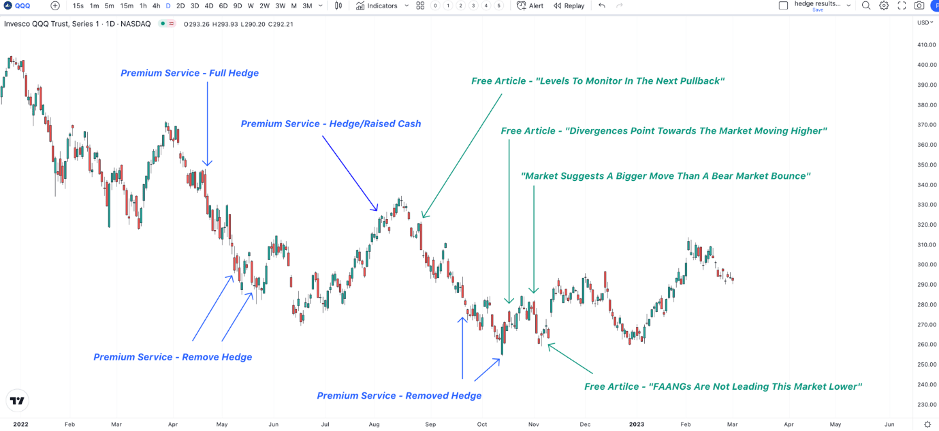
Below is a chart that shows the I/O Fund’s accurate broad market calls, particularly the prediction of a market drop in August and the bottoming in October. These calls were used alongside an automated hedge signal developed by Vincent Duchaine of The Wealth Umbrella, who is an A.I. and Machine Learning engineer.
Bitcoin:
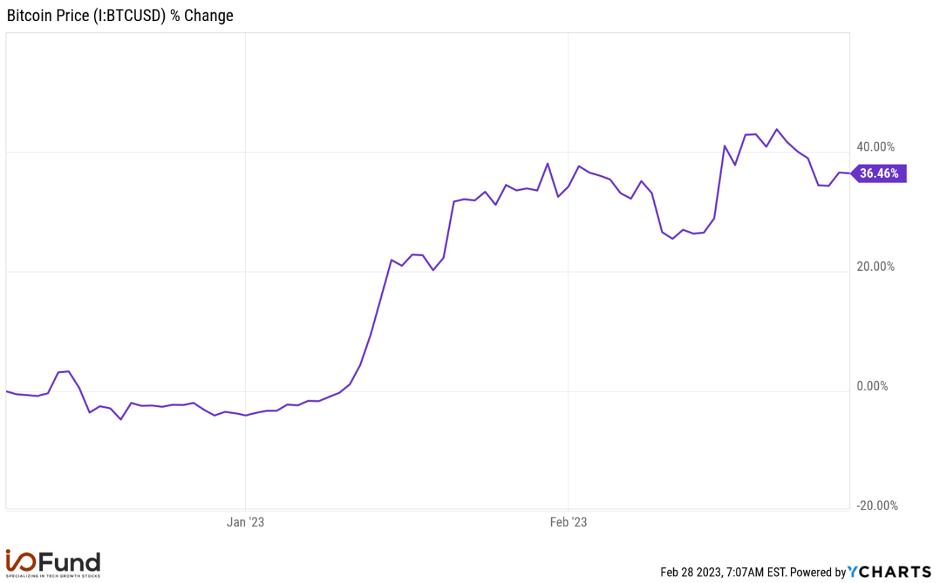
We announced that we were buyers of Bitcoin around $16,000 and gave in-depth analysis on why a major low was likely from these levels in the article, “Bitcoin is Going to Rally Again – Here’s What You Need to Know.”
Per the article, “We are seeing more and more institutional investors, economies and businesses adopting Bitcoin. Though we are in the 4th bear cycle in Bitcoins history, the prior 3 cycles suggest where we are is a rare buying opportunity. There is ample evidence to support the $15,500 level is either a major either a major lovelow or very close to a major low. Both the technical and on-chain analysis support this.”