We Are Raising Our Bitcoin Targets To $106K - $190K
April 26, 2024

Knox Ridley
Portfolio Manager

Bitcoin is an asset where the bulls pound the table to “buy, buy, buy,” and the bears relentlessly and stubbornly call it a scam. In reality, both are the wrong approach. This is because although Bitcoin is the highest performing asset in the past ten years, it’s also the one of the most volatile. Consider that it was trading at $58,000 in March of 2022, and by December of 2022 had lost 72% of its value. That year, the loud and proud Bitcoin bulls were not your friends.
Timing is everything. When it comes to timing, our firm has a proven track record of navigating the life-changing bull case that crypto offers while minimizing the volatility associated with different coins – we achieve this via a unique approach combining technical and on-chain analysis to identify major lows and major tops in each cycle. For example, we diligently detailed to our readers in December of 2022, when Bitcoin was trading in the $16,000 region, that we are “Bullish on Bitcoin”:
“Though we are in the 4th bear cycle in Bitcoin's history, the prior 3 cycles suggest where we are is a rare buying opportunity. There is ample evidence to support the $15,500 level is either a major low or very close to a major low. Both the technical and on-chain analysis support this. As Bitcoin continues to integrate into the global economy, we expect both the volatility and epic returns to calm down. For now, we are content buying Bitcoin at these lows with a long-term mindset.”
One year later, our most recent Bitcoin article stated that the coming pullback into the $39,000 - $35,000 region would likely be “the last great buying opportunity” in this bull cycle. At the time our upper targets were between $75,000 - $132,000. That correction bottomed around $38,500 then led to 90% rally, which topped less than 2% from our $75,000 target.
If Bitcoin were in the Mag 7, it would be the second strongest performer both YTD and on a 1-year basis, edging out Meta at returns of 133% in 1-year and 52% YTD. Had you bought in the $16,000 region, the returns would be 300% in about 17 months’ time.

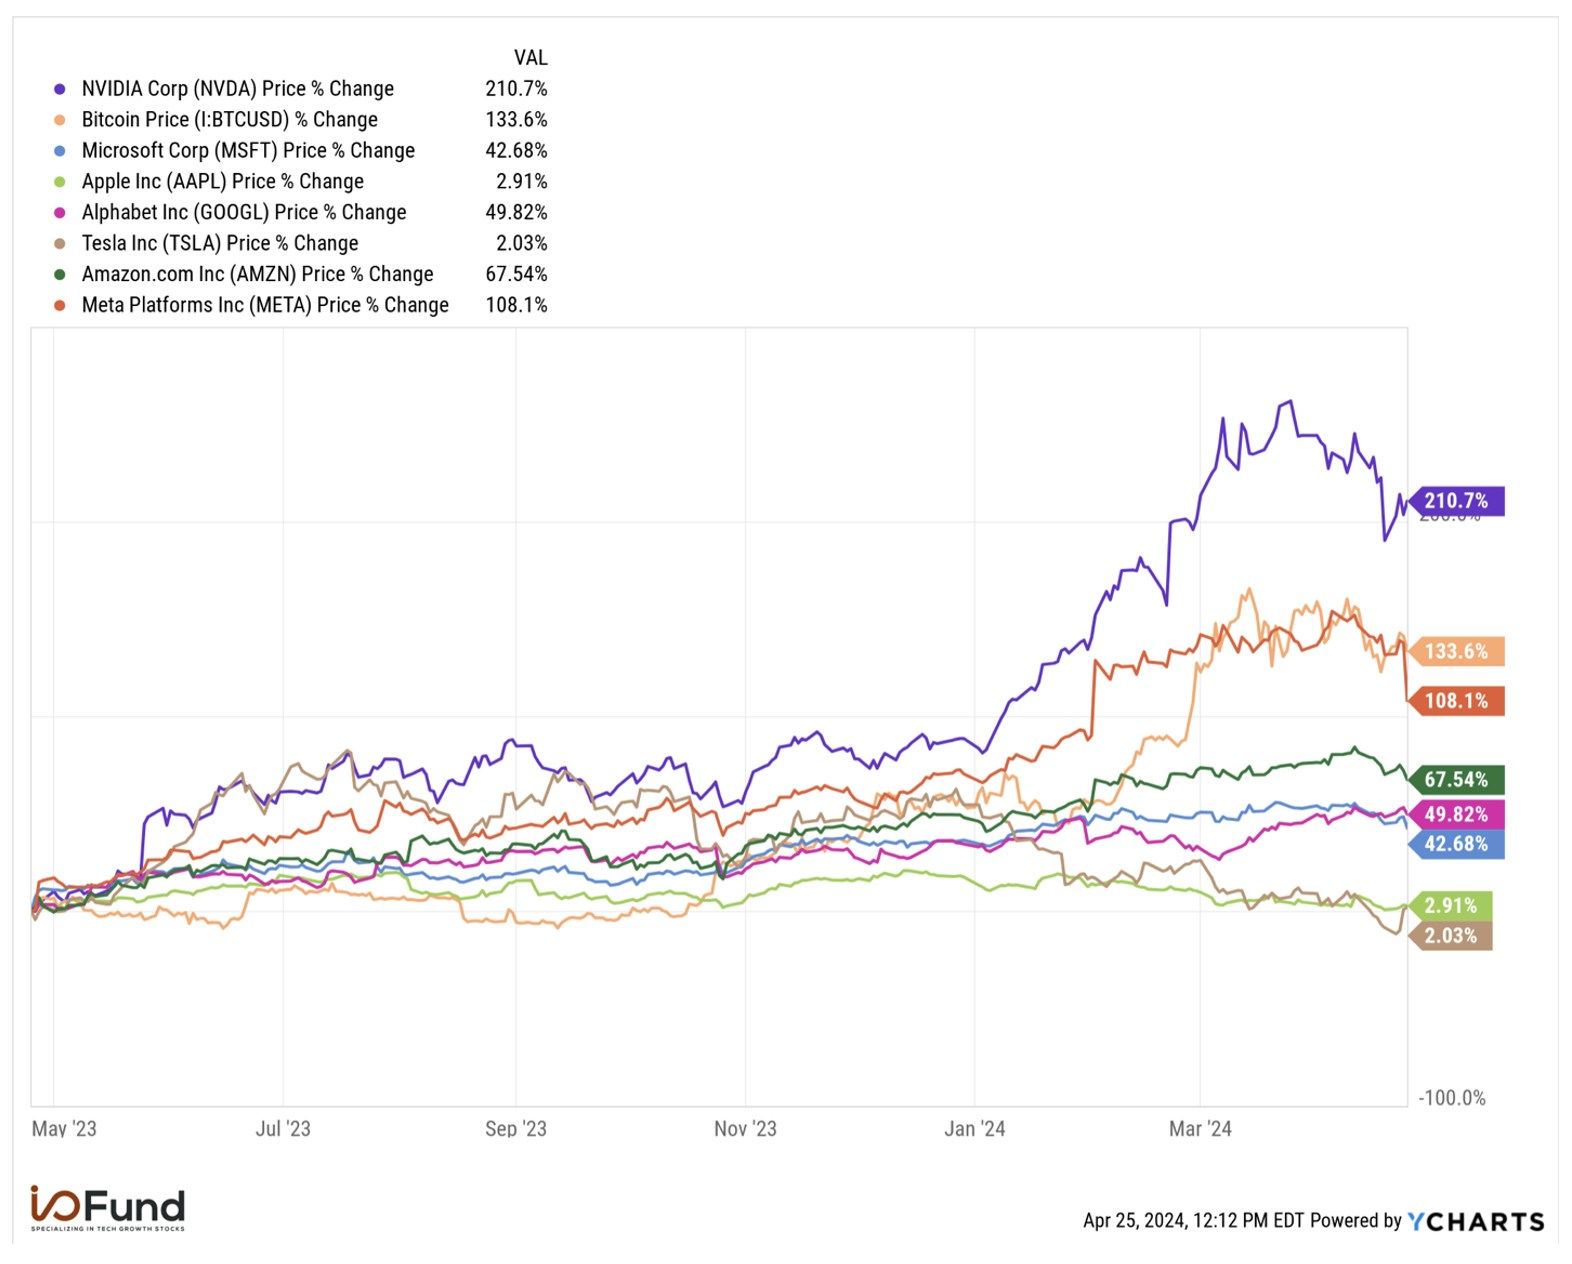
Source: YCharts
Looking forward, an important question to ask is, are we at the end of a bull cycle or do we have more room to run? We believe that there is more room within this uptrend. As a result, we are raising our upper Bitcoin targets, as the current volatility appears to be another correction within a much larger uptrend.
In this article, we will support this thesis through on-chain analysis as well as technical analysis. We will also address how Bitcoin appears to be setting up for higher levels while equities look like they’re topping. The popular narrative is that crypto and stocks – especially tech stocks -- are correlated. It’s our stance that these two investments are not as correlated as many believe, which lends credence to this potential divergence.
Updated Bitcoin Game Plan
We have remained steadfast on the long-term pattern for Bitcoin, which you can see was intact as far back as July of 2022. While the 2022 drawdown went lower than we anticipated, once we got signs of a bottom, we maintained this pattern around the $15,000 lows. The implication was that 2022 was a correction within a much larger uptrend, and that we were going to see a new bull cycle into 2023 - 2024.
As of today, we are more than halfway into the current bull cycle, which is the final 5th wave in a very large 5 wave uptrend that started in late 2018. What this means is that as we approach our upper targets, our game plan will shift from accumulation to distribution.

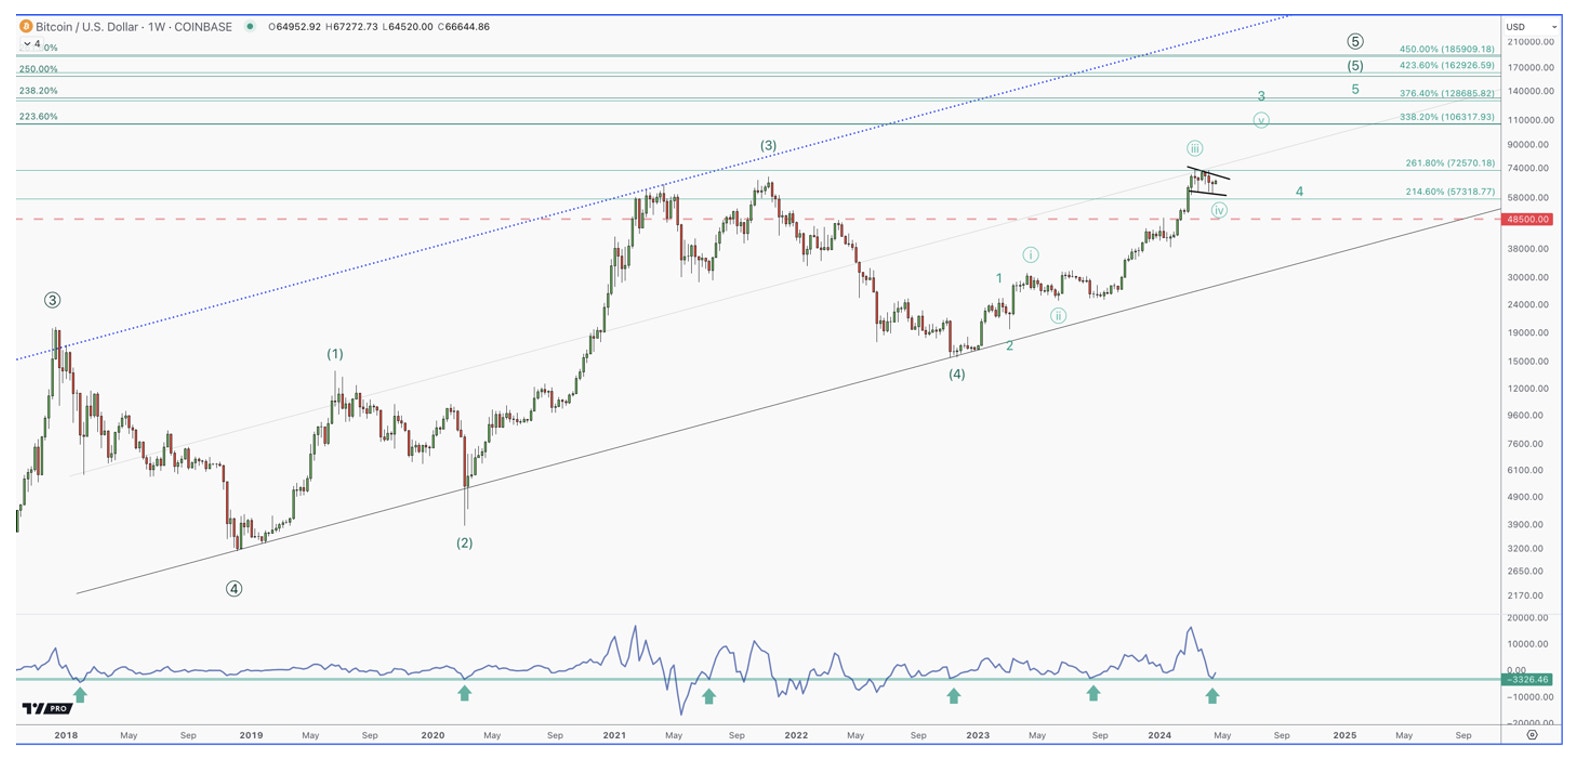
Source: I/O Fund
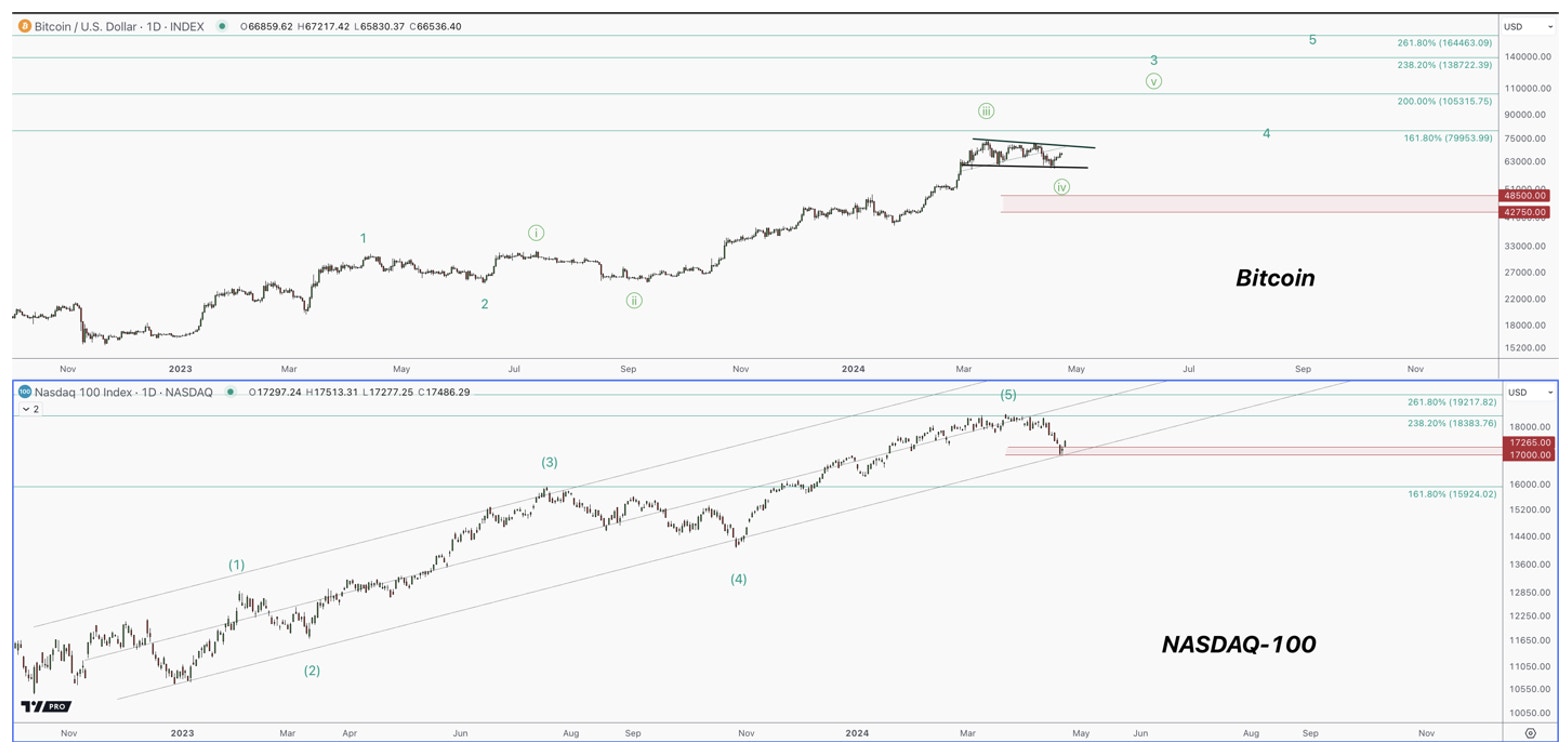
The current drawdown appears to be tracing a bull flag, which is a correction within an uptrend. The $57,000 region is very strong support, which is the upper range of our support zones that need to hold in order for us to push higher. This is over 25% lower than price currently is, which shows the level of strength still in Bitcoin. If we do see another drop, we can go as low as $42,750 without invalidating the larger uptrend in play. So, this ongoing pattern is comfortably intact and has ample room to drop, if we see more volatility.
While the pattern appears to be corrective, and tracing a standard pattern we see within larger uptrends, the momentum oscillator below price is at a major support zone. Note how this support region acted as key lows, especially in the current uptrend that started in late 2022. Also, note how much higher price is compared to other instances where this support was tested. This suggests a low being put in, while also suggesting that we have ample room to push higher in the coming weeks to months.
Because of this development, we are increasing our upper target zone from $75,000 - $130,000 to $106,000 on the low end, and $190,000 on the high end. As long as the $42,750 support region holds on any on-going volatility, then we have no reason to doubt the uptrend in place. That being said, we do not see the same upside within the equity markets, which begs the question – is Bitcoin highly correlated to tech stocks?
Bitcoin vs. Tech
On April 18th, we saw an escalation of the concerning geopolitical conflict between Iran and Israel. As a result, the NASDAQ-100 closed down over 2% the following day, with AI leaders like NVDA giving back 10% in a single day.
There were not many areas of tech that were spared on that day of selling, as investors sought to de-risk at any price. One would think Bitcoin would follow tech on this day, but it was instead up nearly 1%. In fact, many alt-coins shrugged off this news and pushed higher. Granted this is only one day, but it is an intriguing development. This was the first instance of panic selling in over 6 months where we saw investors dumping high risk tech stocks, and Bitcoin not only did not participate, but saw buyers.
If we look back at the long-term correlation to Bitcoin and the heavily focused NASDAQ-100, you will note that the majority of times, these two investments are closer to having minimal to to no correlation. This is in contrast to being highly correlated, as many would believe.

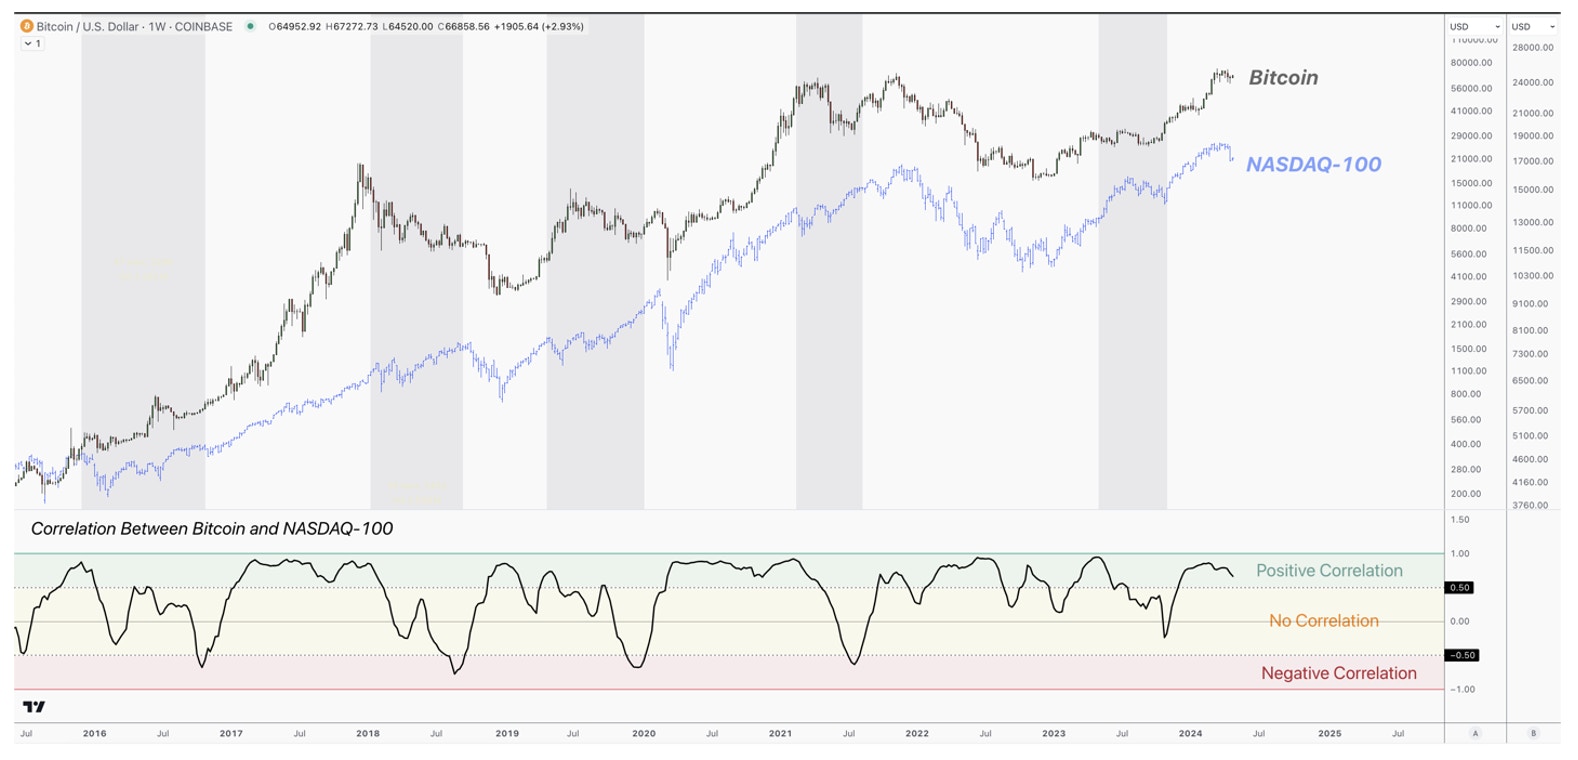
Source: I/O Fund
The above chart measures the correlation between these two investments. The best way to read the chart is when the line is moving up, it means the two are correlated and heading in the same direction, while the inverse indicates they are moving in opposite directions. Also, when the cumulative reading is above 0.5 (green), the two investments are highly correlated, between 0.5 and -0.5 (yellow) the two have minimal to no correlation, and when the reading is below -0.5 (red) they have an inverse correlation and are moving in the opposite direction.
Considering the correlation is cumulative on a weekly scale, the two investments have to stay inversely correlated for some time in order to cross below 0. As you can see, there are significant periods where the two have been inversely correlated, which I’ve marked with the gray vertical shades.
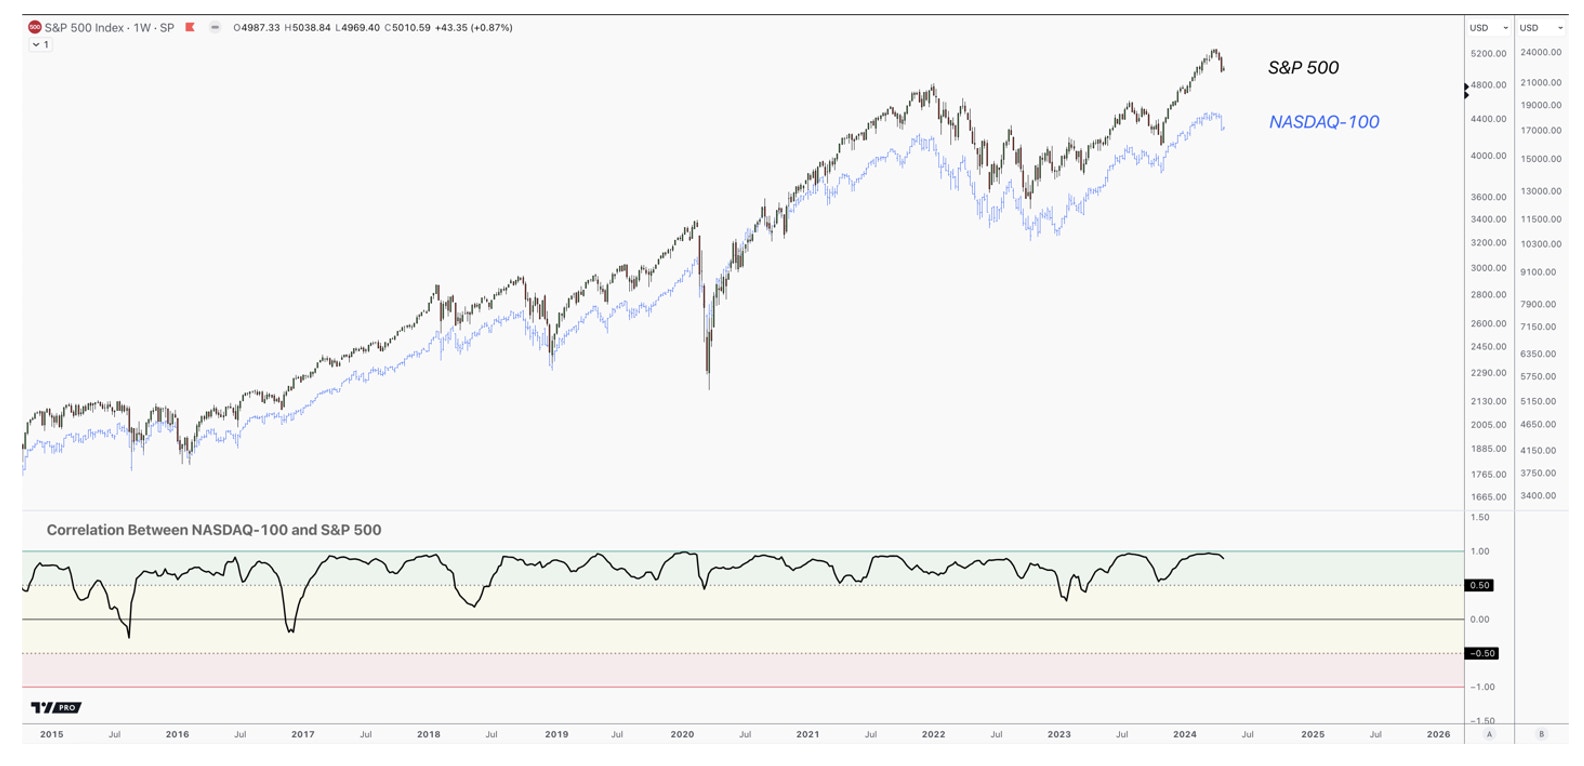
For reference, the below chart shows the correlation between the S&P 500 and the NASDAQ-100 through the same period. While there are brief periods where the two indexes have diverged, the cumulative correlation rarely goes below 0.5% (green), and only briefly crossed the 0 line.

Source: I/O Fund
The point is to show actual data in regards to the popular narrative that Bitcoin is just another tech equity play. The data shows that the cumulative correlation has periods where it is highly correlated to tech, but what is key to understand, is that it also has extended periods where it is inversely correlated. The norm is that the two investments have had a low to no correlation, which supports the inverse move that we saw between Bitcoin and tech stocks on April 19th.
This supports a probable scenario where equities could put in a top while Bitcoin continues to run higher.
Sign up for I/O Fund's free newsletter with gains of up to 221% - Click here
Equities Topping While Bitcoin Goes Higher
In our March report, we showed how the current bull market leaders, the Magnificent 7, were topping, one at a time, while the broad market was continuing to push higher. At the time of the report, only 3 of the Mag 7 were making new highs with the broad market. We then saw the AI leaders within the semiconductor space, including Nvidia, top around early March, while the broad market pushed higher into April.
Seeing the bull market leaders diverge from the broad market is usually a sign of coming weakness, not strength. More times than not, we will see the leaders top first when a meaningful change in trend is about to happen, which we warned our readers about. If we were going to push higher, these leaders needed to breakout to new highs, and until then, we were at risk of a trend change.
This lines up with the potential topping pattern we are seeing within the equity markets, compared to Bitcoin, which appears to have more room to run.

Source: I/O Fund
The above chart shows the NASDAQ-100 has completed a mature 5 wave pattern off the 2022 low, and has broken the first of two major supports – 17,265 and 17,000. Bitcoin, on the other hand, is still in an incomplete 5 wave pattern, which is still tracing the 3rd wave higher. Note the current correction is taking the shape of a bull flag, and is nearly 25% above the first critical support level.
The reason for this could have several explanations. For one, it’s worth noting that the demand for Bitcoin has increased substantially, while its supply has remained the same. Spot Bitcoin ETFs have quickly become a popular investment vehicle, and have seen a surge in net inflows, surpassing more than $30B AUM in mid-April after amassing $17B in funds in less than two months after a launch in mid-January. For example, BlackRock’s iShares Bitcoin ETF recorded 71 consecutive days of net inflows. In addition, trading volume on the ETFs nearly tripled in March, reaching $111 billion – for an asset class that launched only two months prior, that’s a significant figure.
Another explanation is the fact that not all markets top and bottom at the same time. For example, small caps topped in 2021 while the NASDAQ-100 continued higher into 2024. Therefore, Bitcoin could be one of the last assets to put in a larger top, after the NASDAQ-100. This would lead to several lower highs within a large range for the NASDAQ-100, while Bitcoin makes its final series of higher highs. After which, they would align in a potential downtrend.
Another answer could be something more fundamental. Bitcoin was created to answer a specific flaw within the centralized banking system. It is fundamentally different than a tech stock, and has the potential to provide a hedge against various banking and/or currency problems that tech stocks would not be able to address. In this case, Bitcoin could be picking up on some deeper issue within the system, which is causing the potential divergence.
The other scenario is that I could be wrong, and the NASDAQ-100 holds this support region, the Mag 7 and AI Semis find more strength, and push higher with Bitcoin, or vice versa. I’m open to this, but until Bitcoin starts breaking critical support levels in a direct fashion, like most equity markets recently have, there is no reason to pivot away from a more bullish outcome in Bitcoin.
On Chain Analysis
For those that are not familiar with on-chain data, it is the unique fundamental analysis within crypto, and a relatively new field of study. We partnered with WealthUmbrella, a team of Machine Learning engineers and professors, to provide this level of analysis within the crypto space. According to WealthUmbrella, the underlying strength that our technical analysis is picking up on is also being supported within on-chain data. The below section was written by Vincent Duchaine, CEO of WealthUmbrella.
Bitcoin’s recent move to $73,000 created some of the most overbought conditions we have seen throughout Bitcoin’s history. One of the indicators used to gauge these overbought levels measures the value of Bitcoin’s network through the increase/decrease in active users.
At the recent high in Bitcoin, this indicator, which only rose briefly to a historically high value, gave us a reading of 3.3. As you can see below, this reading represents an outlier in Bitcoin history.

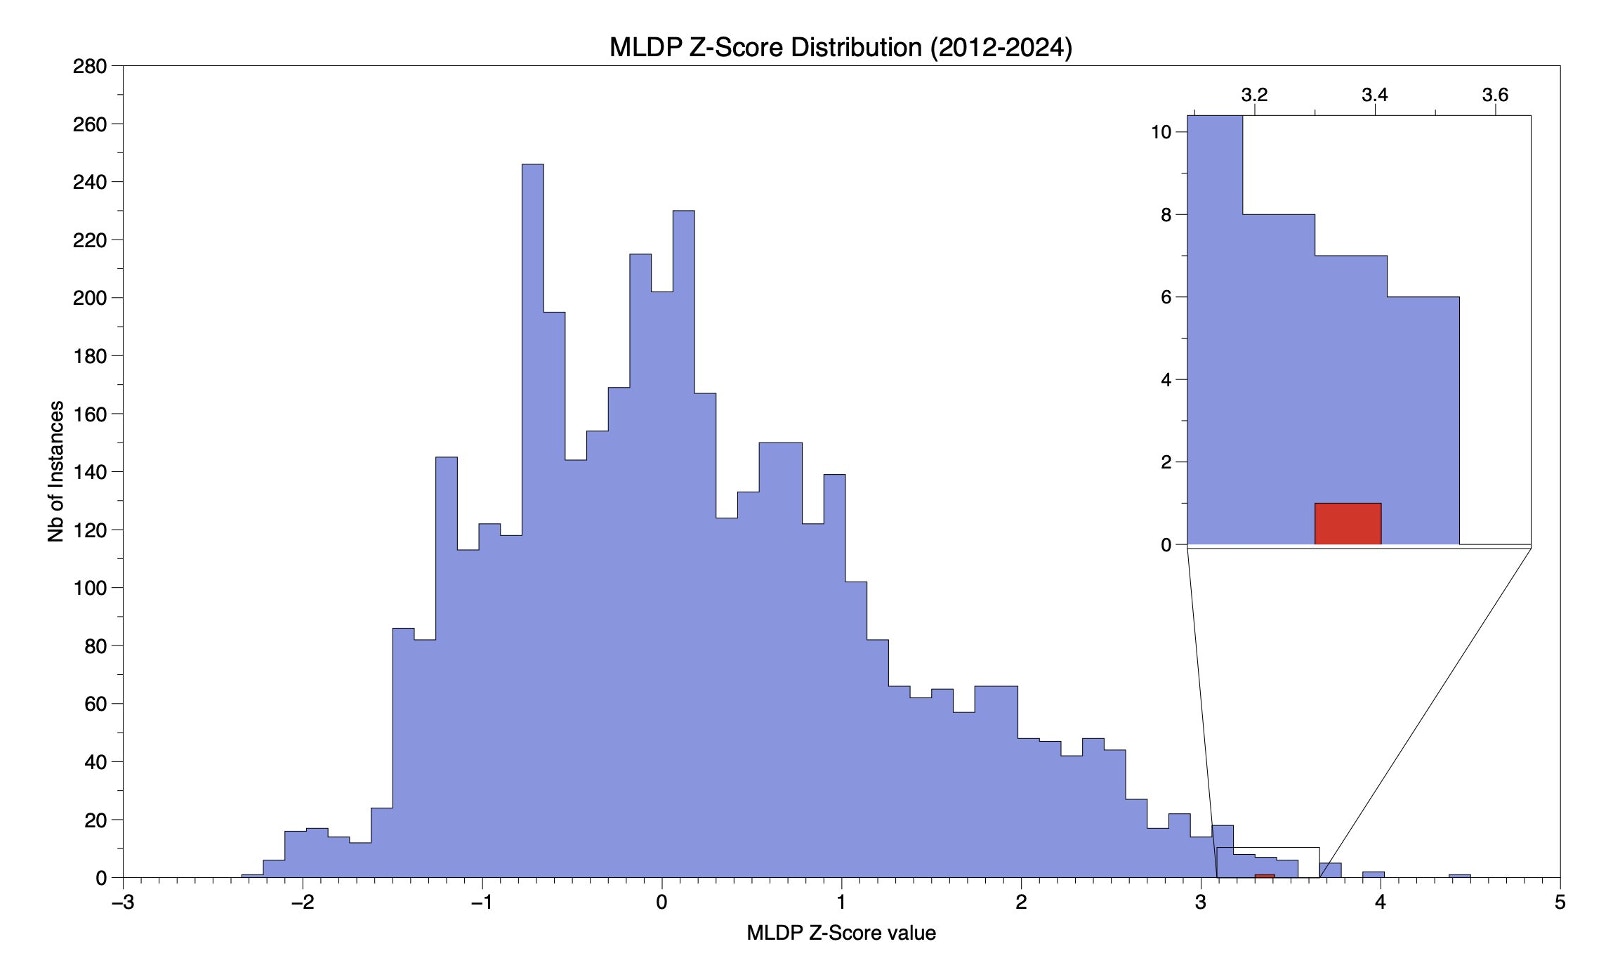
Source: I/O Fund
A reading this high historically leads to a top, of sorts. The good news is that the recent volatility has taken this indicator back to a reading of 0.84, which is in the lower range of what we have seen during a correction in a bull market over the last 6 years. This further confirms our long-standing outlook that the bull cycle in Bitcoin will likely move higher.

Source: I/O Fund
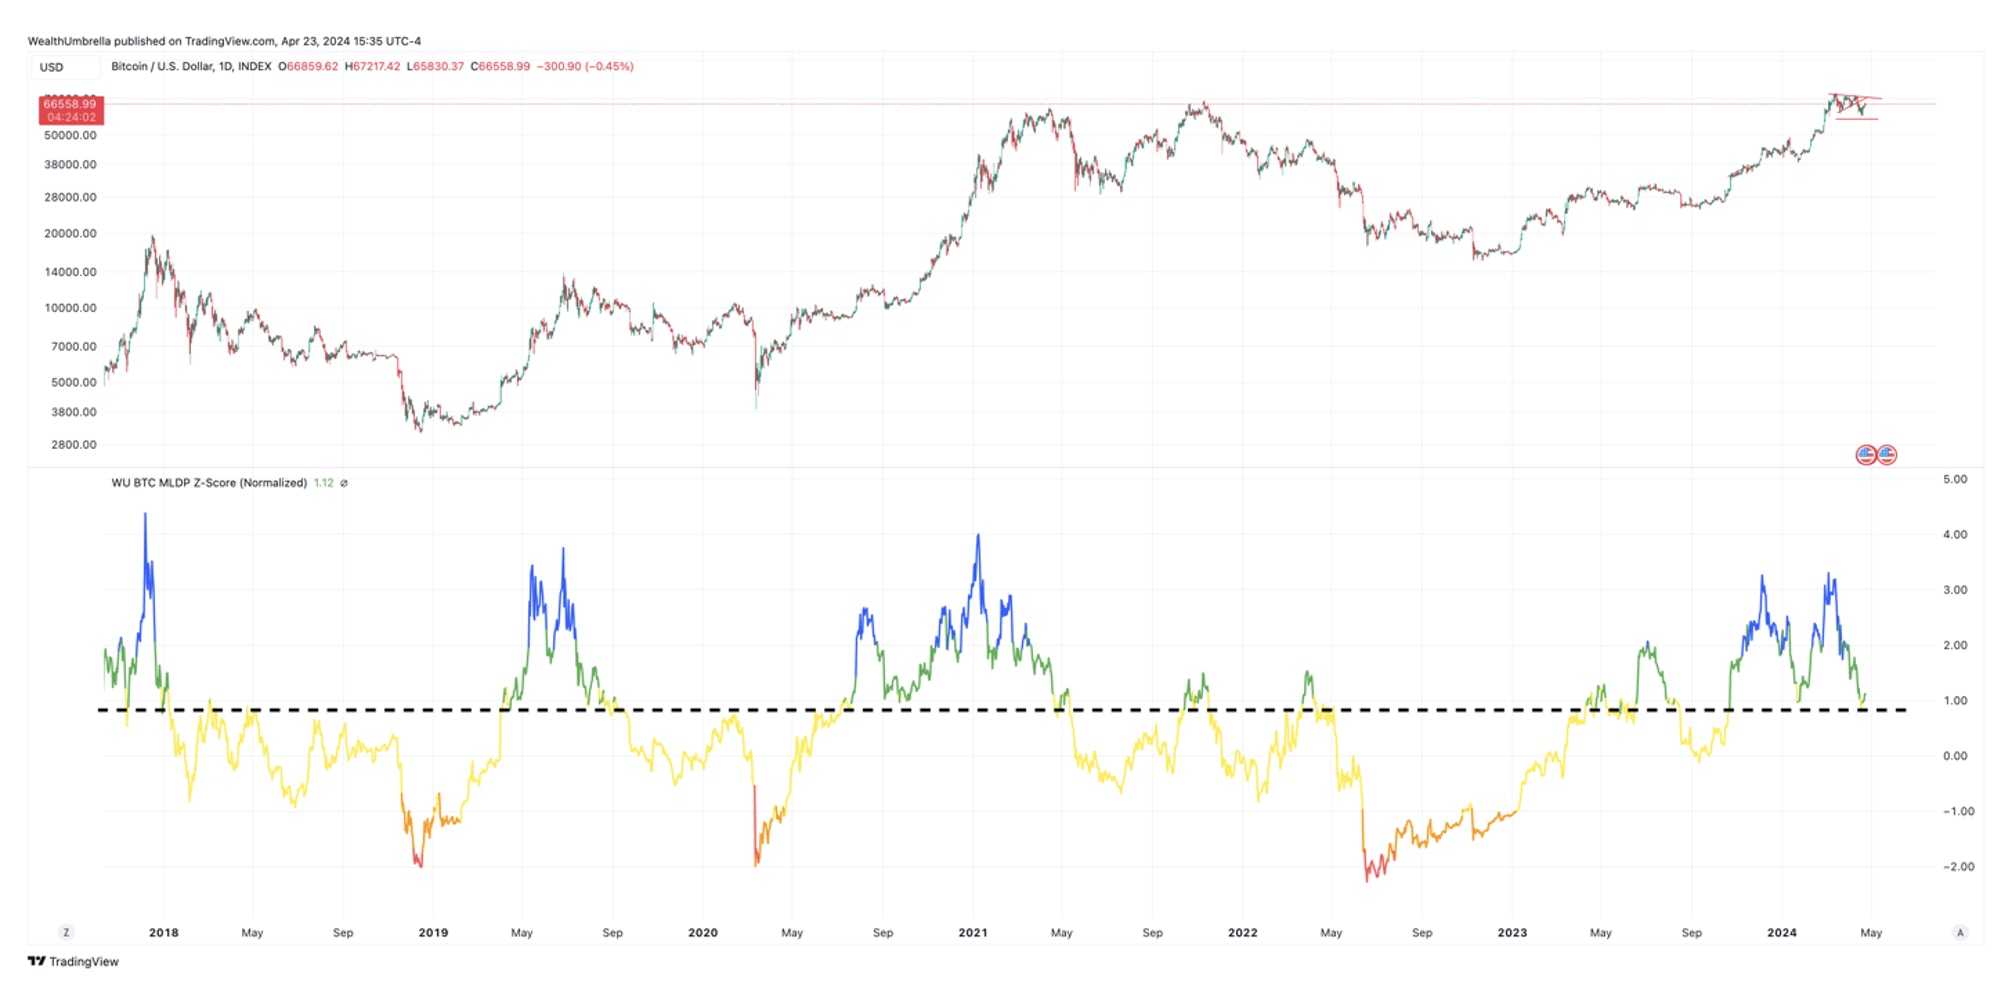
This extreme overbought reading was also picked up by our SOPR Indicator, which stands for the Spent Output Profit Ratio. This indicator measures the daily transactions in Bitcoin and measures if the combined ratio has a profit or loss based on when they were bought. As the indicator moves up, it is signaling that all the majority of daily transactions in Bitcoin were sold for a profit.
As you can see, this indicator also reached a historically high reading when Bitcoin first hit $73,000. However, it has greatly cooled down since and is now slowly curving to the right.

Source: I/O Fund
These two metrics were warnings that a correction was likely coming due to being extremely overbought. However, since then, we have seen them cool off to a level that suggests we could be getting close to the bottom of the current correction and resume the uptrend.
This thesis is being supported by other metrics that we track. For example, since the arrival of the new Bitcoin ETF, the amount of Bitcoin that hasn’t moved in more than a year was in a constant drop, implying that long-term holders (hodlers) were finally taking gains, which was increasing supply. This selling by the Bitcoin hodlers has since stopped since April 2nd, which you can see in the chart below.

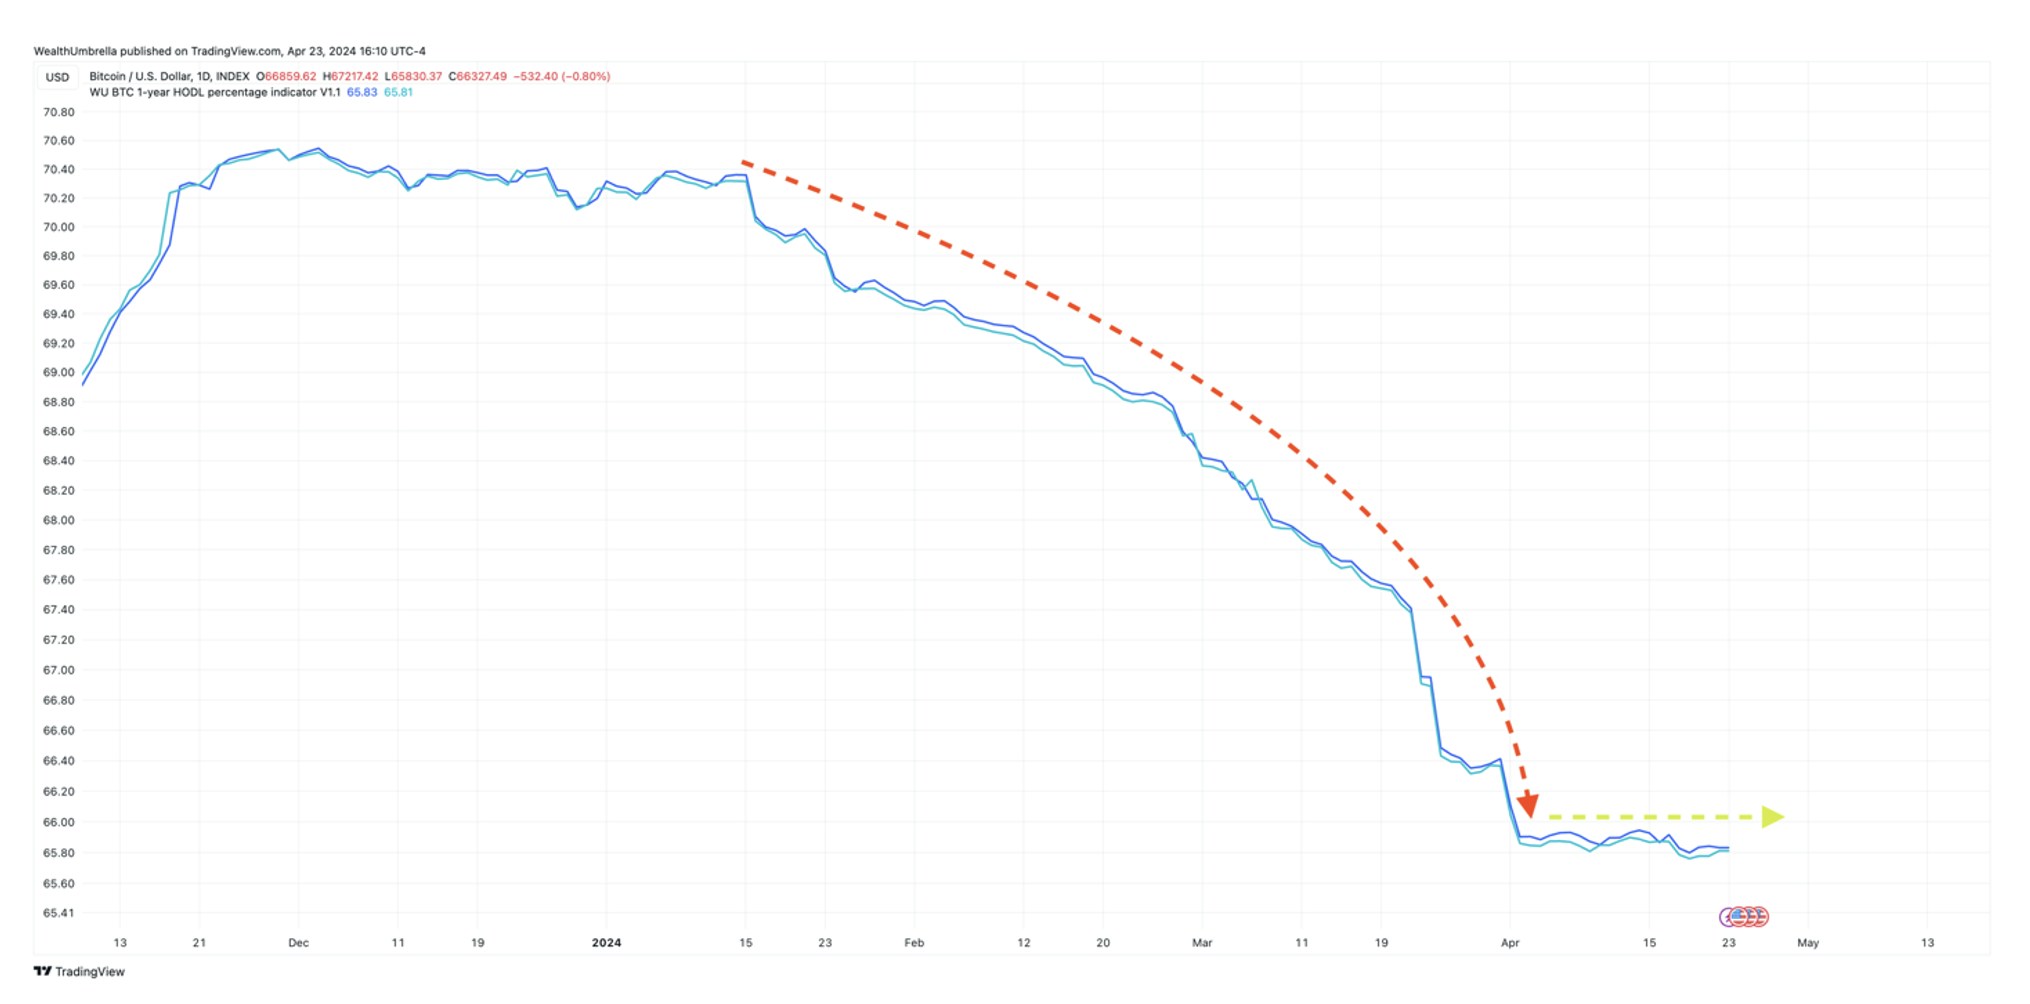
Source: I/O Fund
Like any asset, Bitcoin's price movements are the result of supply and demand. We are now seeing long-term holders of Bitcoin cease the selling that started in late 2023. This is bullish as it creates a constraint on the supply side of the equation.
Not only are hodlers not selling, but whales have also bought the recent dips in a notable way. The below chart measures large block trades within Bitcoin. The most recent spike happened last Thursday, April 18th, when whales bought 19,700 BTC at an average price of $62.5k.

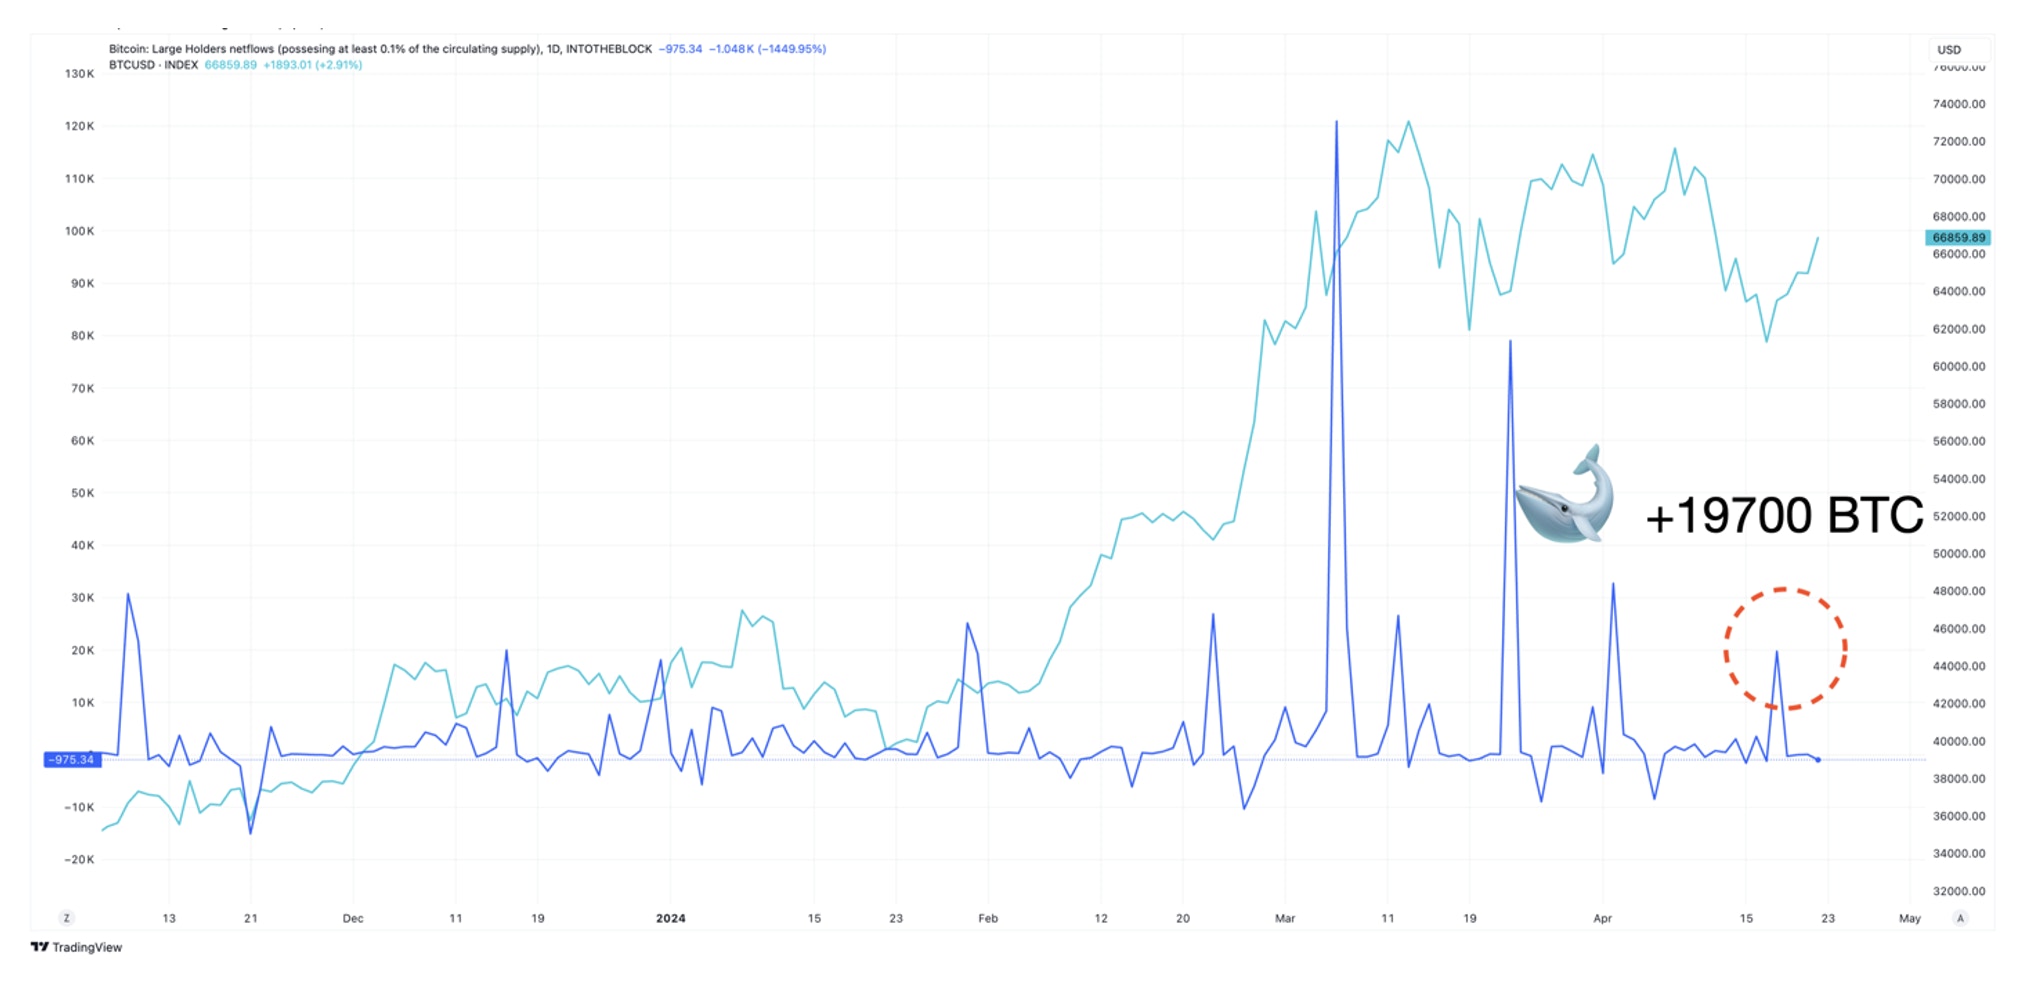
Source: I/O Fund
Regarding the demand for Bitcoin, we have historically measured this through monitoring the number of newly created Bitcoin addresses with a non-$0 balance. As new addresses are created that actively buy Bitcoin, this implies that demand is increasing. However, this is likely not as relevant in light of the new Bitcoin ETFs.
Before the creation of these ETFs, the predominant means to access Bitcoin was through the creation of wallets or personalized crypto exchange accounts. Now, an investor can simply buy an ETF on a public exchange and get access to Bitcoin’s price movements. This has now opened the door to institutional investors as well as investors who want diversification but did not want to deal with the hassle of dealing with crypto exchanges and the safety concerns that come with them. Regarding demand, this development is arguably the most important element in Bitcoin’s history, and we view as quite bullish in regards to the demand side of the price equation. Lead Tech Analyst Beth Kindig went on Fox Business News and discussed how Bitcoin has never had a more fundamentally bullish moment:
Bitcoin has never had a more fundamental bullish moment: Beth Kindig (X.com)
Bitcoin has never had a more fundamental bullish moment. I spoke with @cvpayne about the fundamentals and our new price targets for $BTC.@FoxBusiness pic.twitter.com/HcC584EXaW
— Beth Kindig (@Beth_Kindig) December 21, 2023
Source: Beth's Twitter
In summary, the internals are supporting higher levels, as we are now seeing demand start to catch up with supply. We view the current state of Bitcoin’s pullback as a buying opportunity within a larger uptrend. This is confirmed by one of our most powerful tools, which we call the Kwiatkowski Indicator, named after its creator. This tool is designed to spot tops by looking at the profit of all market participants in an organized way. It is currently indicating a value of around 12, while we don’t expect a cyclical top until 35.

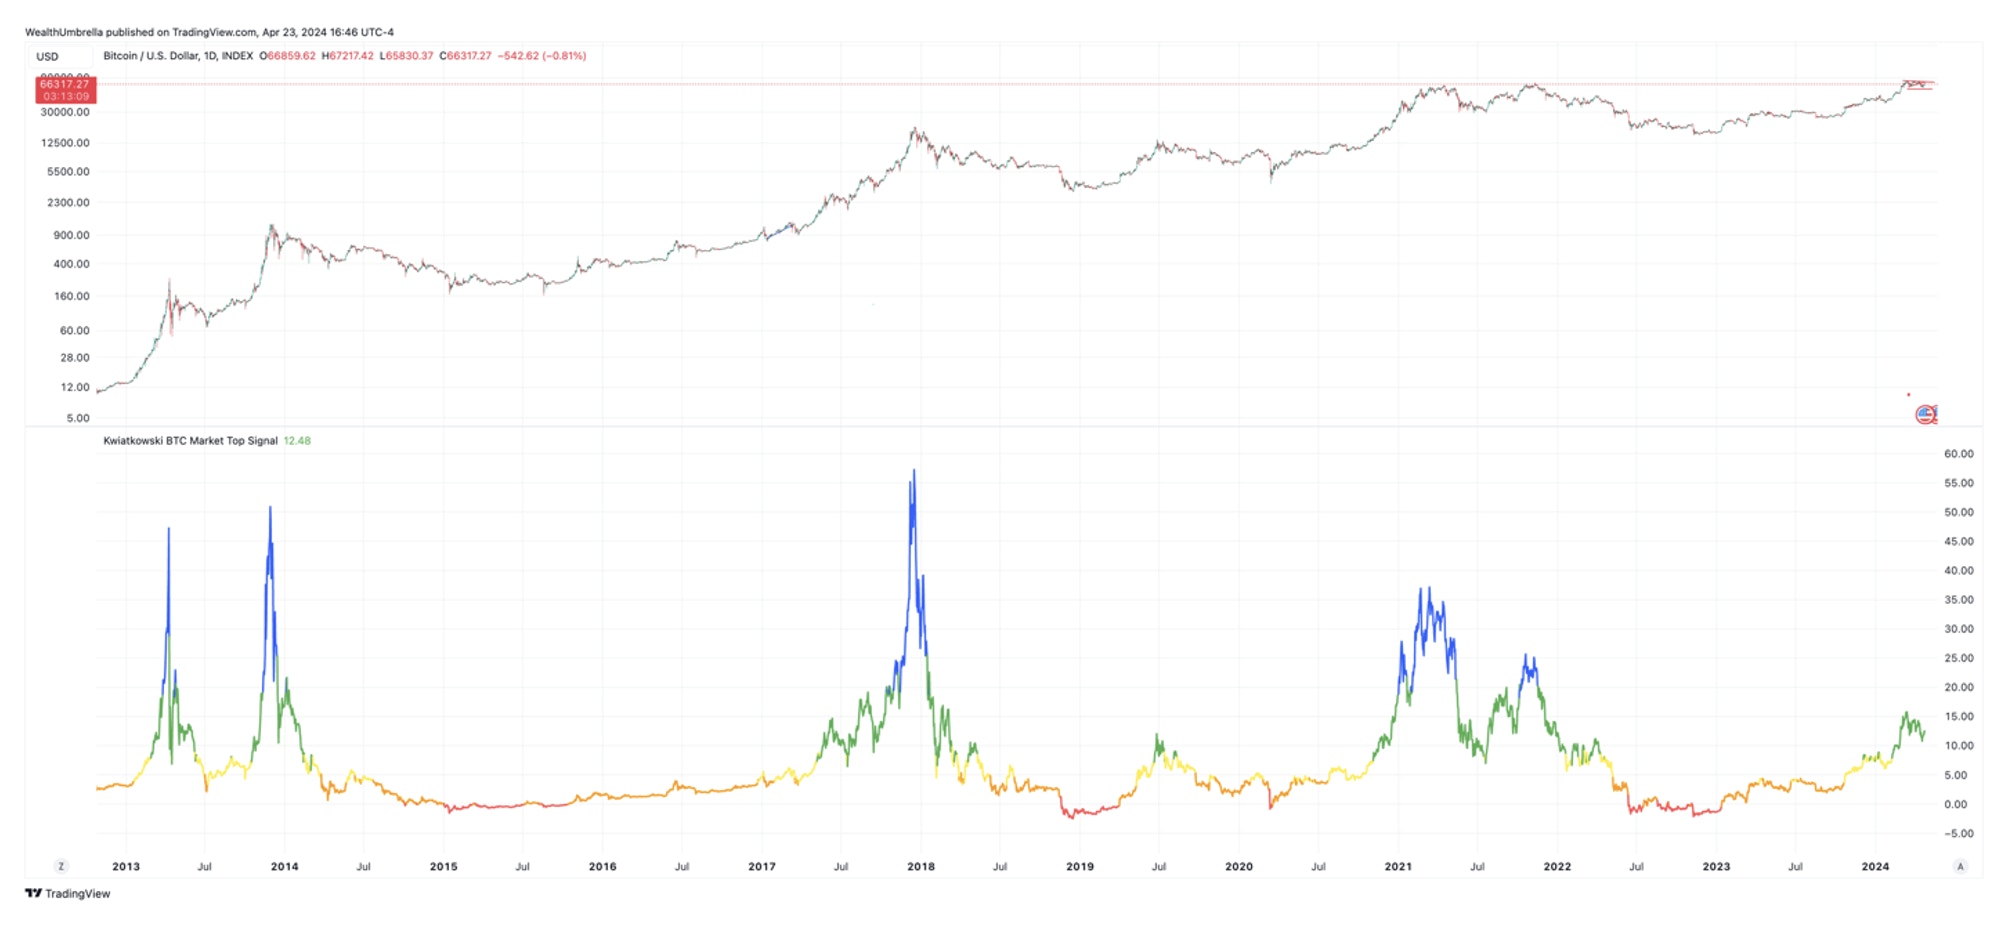
Source: I/O Fund
Conclusion:
We are seeing evidence that Bitcoin wants to go higher, while equities appear to be setting for a top. Bitcoin has a history of not being correlated with tech stocks, so this scenario is not as improbable as the popular narrative would suggest. Both technical and on-chain analysis support higher levels for Bitcoin, and as long as any further weakness holds $42,750, we view this dip as a buying opportunity.
If you own crypto or are looking to own crypto stocks, consider joining us for our next broad market webinar. Every Thursday at 4:30 pm Eastern, the I/O Fund team holds a webinar for premium members to discuss how to navigate the broad market, manage risk, as well as revealing our various long-term game plans regarding stock and crypto entries and exits. We offer trade alerts plus an automated hedging signal. The I/O Fund team is one of the only audited portfolios available to individual investors. Learn more here.
Please note: The I/O Fund conducts research and draws conclusions for the company’s portfolio. We then share that information with our readers and offer real-time trade notifications. This is not a guarantee of a stock’s performance and it is not financial advice. Please consult your personal financial advisor before buying any stock in the companies mentioned in this analysis. Beth Kindig and the I/O Fund own BTC at the time of writing and may own stocks pictured in the charts.
Recommended Reading:


More To Explore
Newsletter

Nvidia and Google Are Crowding TSMC’s N3 Node - Can Intel Fill the Gap?
Nvidia is moving its next-generation Rubin GPUs from 4nm to 3nm, yet Google’s latest TPUs are already on N3 and are expected to remain there. Meanwhile, a growing number of AI CPUs from Nvidia, Amazon

Intel vs TSMC: How CoWoS Packaging Constraints Could Create an Opportunity for Intel Foundry
Taiwan Semiconductor (TSMC) is the single, most important company to the AI industry. However, to compete with the incumbent, Intel does not need to beat TSMC at leading-edge manufacturing. It only ne

Big Tech’s Free Cash Flow is Turning Negative – Who's Next?
Big Tech’s AI revenue is accelerating, but free cash flow is moving sharply in the opposite direction. Across Google, Microsoft, Meta and Amazon, capex is rising much faster than operating cash flow a
Big Tech Earnings Preview: Is AI Monetization Finally Catching Up to Capex?
The most pronounced difference between 2026’s tech rally compared to rallies in the past is which companies have been left out of it. The names most associated with the AI trade have hardly participat
Nvidia, CXL, and the Battle to Improve AI Inference Economics
This is Part 2 of our two-part series on AI inference economics. In Part 1 — Why Nvidia's Next AI Battle Is About Tokens per Watt, we laid out why tokens per watt has become the defining metric for in
Why Nvidia’s Next AI Battle Is About Tokens per Watt
As hyperscalers move from building AI infrastructure to monetizing it, tokens per watt helps to reflect if revenue is scaling and if profitability is improving. Offload engines can increase tokens per

Micron Is Up 900%. Here’s Why the AI Memory Trade May Still Have Room to Run
Over the past 10 months, memory chip stocks have gone from being solid beneficiaries of the AI boom to capturing a massively outsized piece of the return pie. The inflection in Micron’s performance de

Why the S&P 500 Shrugged Off the Iran War — and What Could Finally Break the Rally
On February 28th, the U.S. went to war with Iran, and the market was handed the kind of shock it hasn't contended with for years. The conflict set off a chain reaction across the region: an ongoing su

Nvidia, CoreWeave, and Nebius: Inside the Circular Financing of the GPU Boom
Neoclouds are one of the more hotly debated AI business models, with CoreWeave and Nebius being the two most widely recognized names. These companies have seen their sales, backlog, and share prices s

AMD, Nvidia, Arm, Intel: Inside the $120 Billion CPU Gold Rush
CPUs have gone from an afterthought to becoming the AI trade’s next great bottleneck – and with AMD, Nvidia, Arm and Intel circling a market that is doubling nearly overnight, the only question left i
